Thread tracing
Use this page to understand how end-user feedback is collected and how Project Owners can review feedback trends to improve answer quality.
Plan support
- Essential plan and above
How it works
The feedback system includes two flows to capture the most relevant context:
- AI response feedback: Focuses on text-based logic, such as SQL generation, data retrieval, and instruction following.
- Chart visualization feedback: Focuses on the accuracy of visual data, chart types, and rendering instructions.
All feedback is aggregated in the Thread tracing portal, helping teams identify patterns in failures and prioritize improvements.
Send feedback
AI response feedback
When interacting with Wren AI, you can help improve the system by submitting feedback:
- Rate the response: Below any AI answer or chart, click Thumbs-up (Helpful) or Thumbs-down (Needs improvement).
- Select the issue: If you click Thumbs-down, a Provide additional feedback window will appear. Select the relevant tags (for example, “Incorrect chart type”).
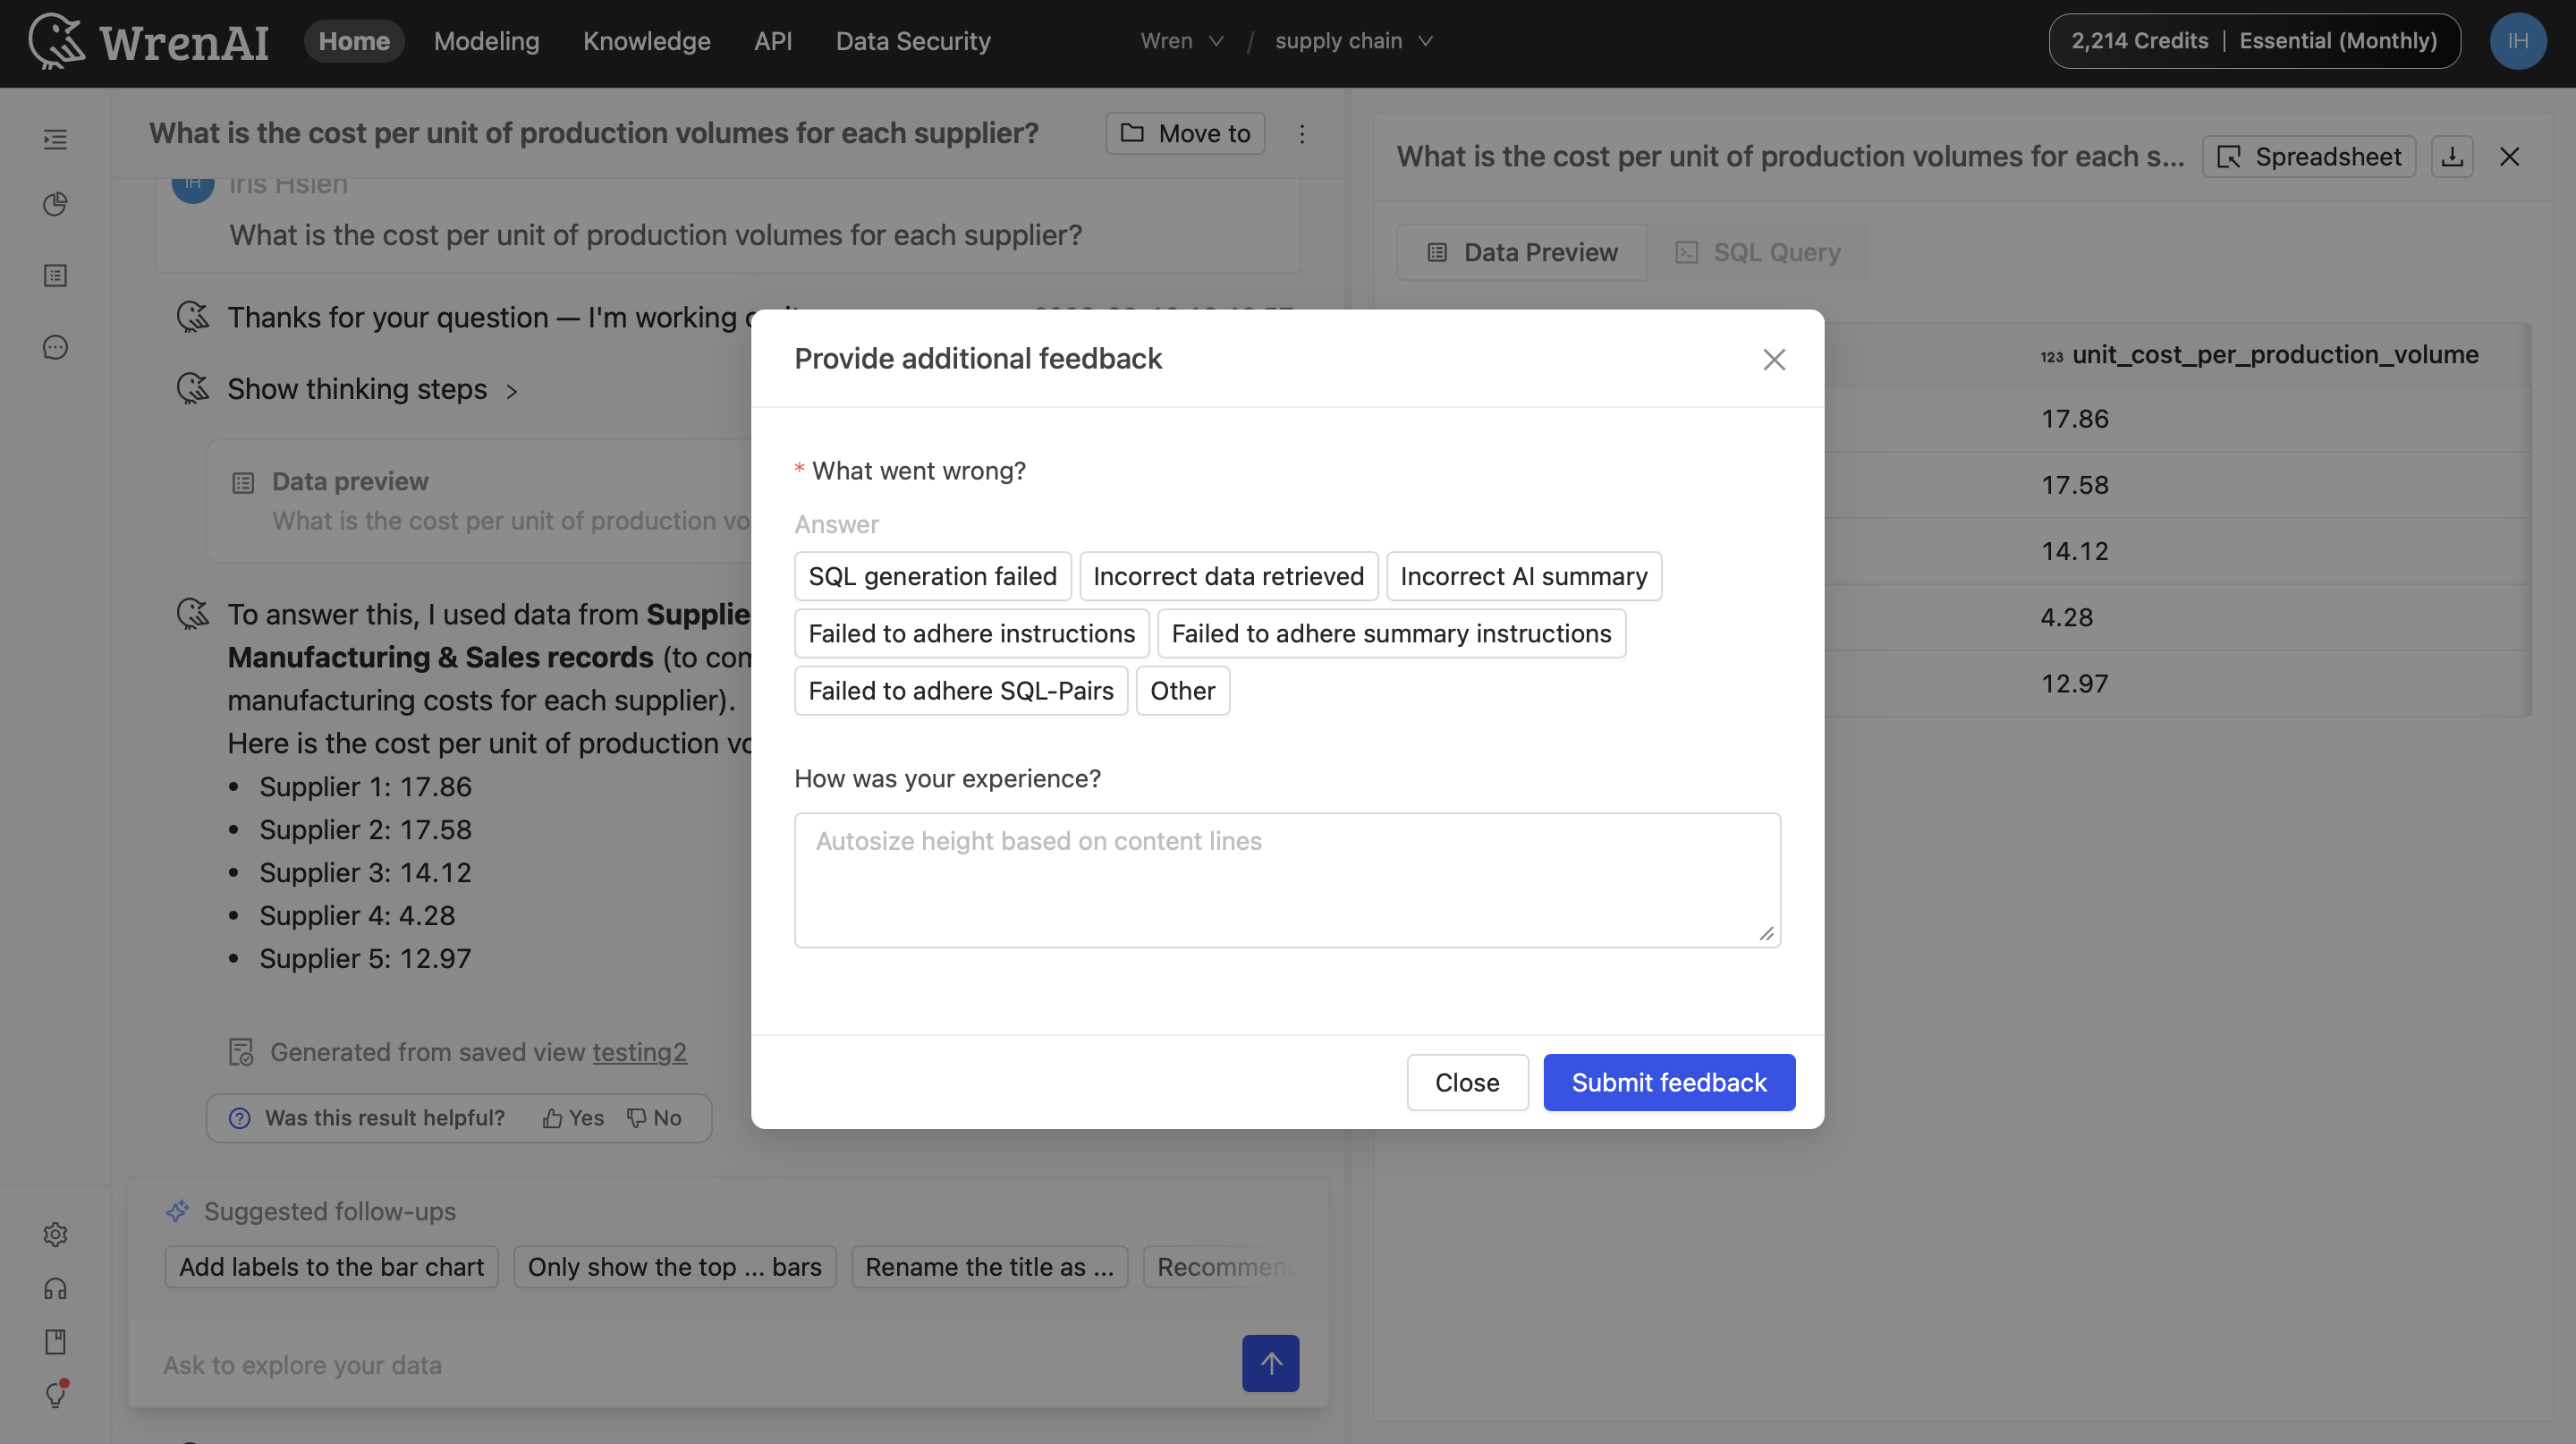
- Provide context:
- Conditional dropdowns: If you select an “Instruction” tag, an additional dropdown appears so you can choose the exact rule the AI missed.
- Description: Briefly describe the issue to give more context to the team.
- Submit: Click Submit feedback.
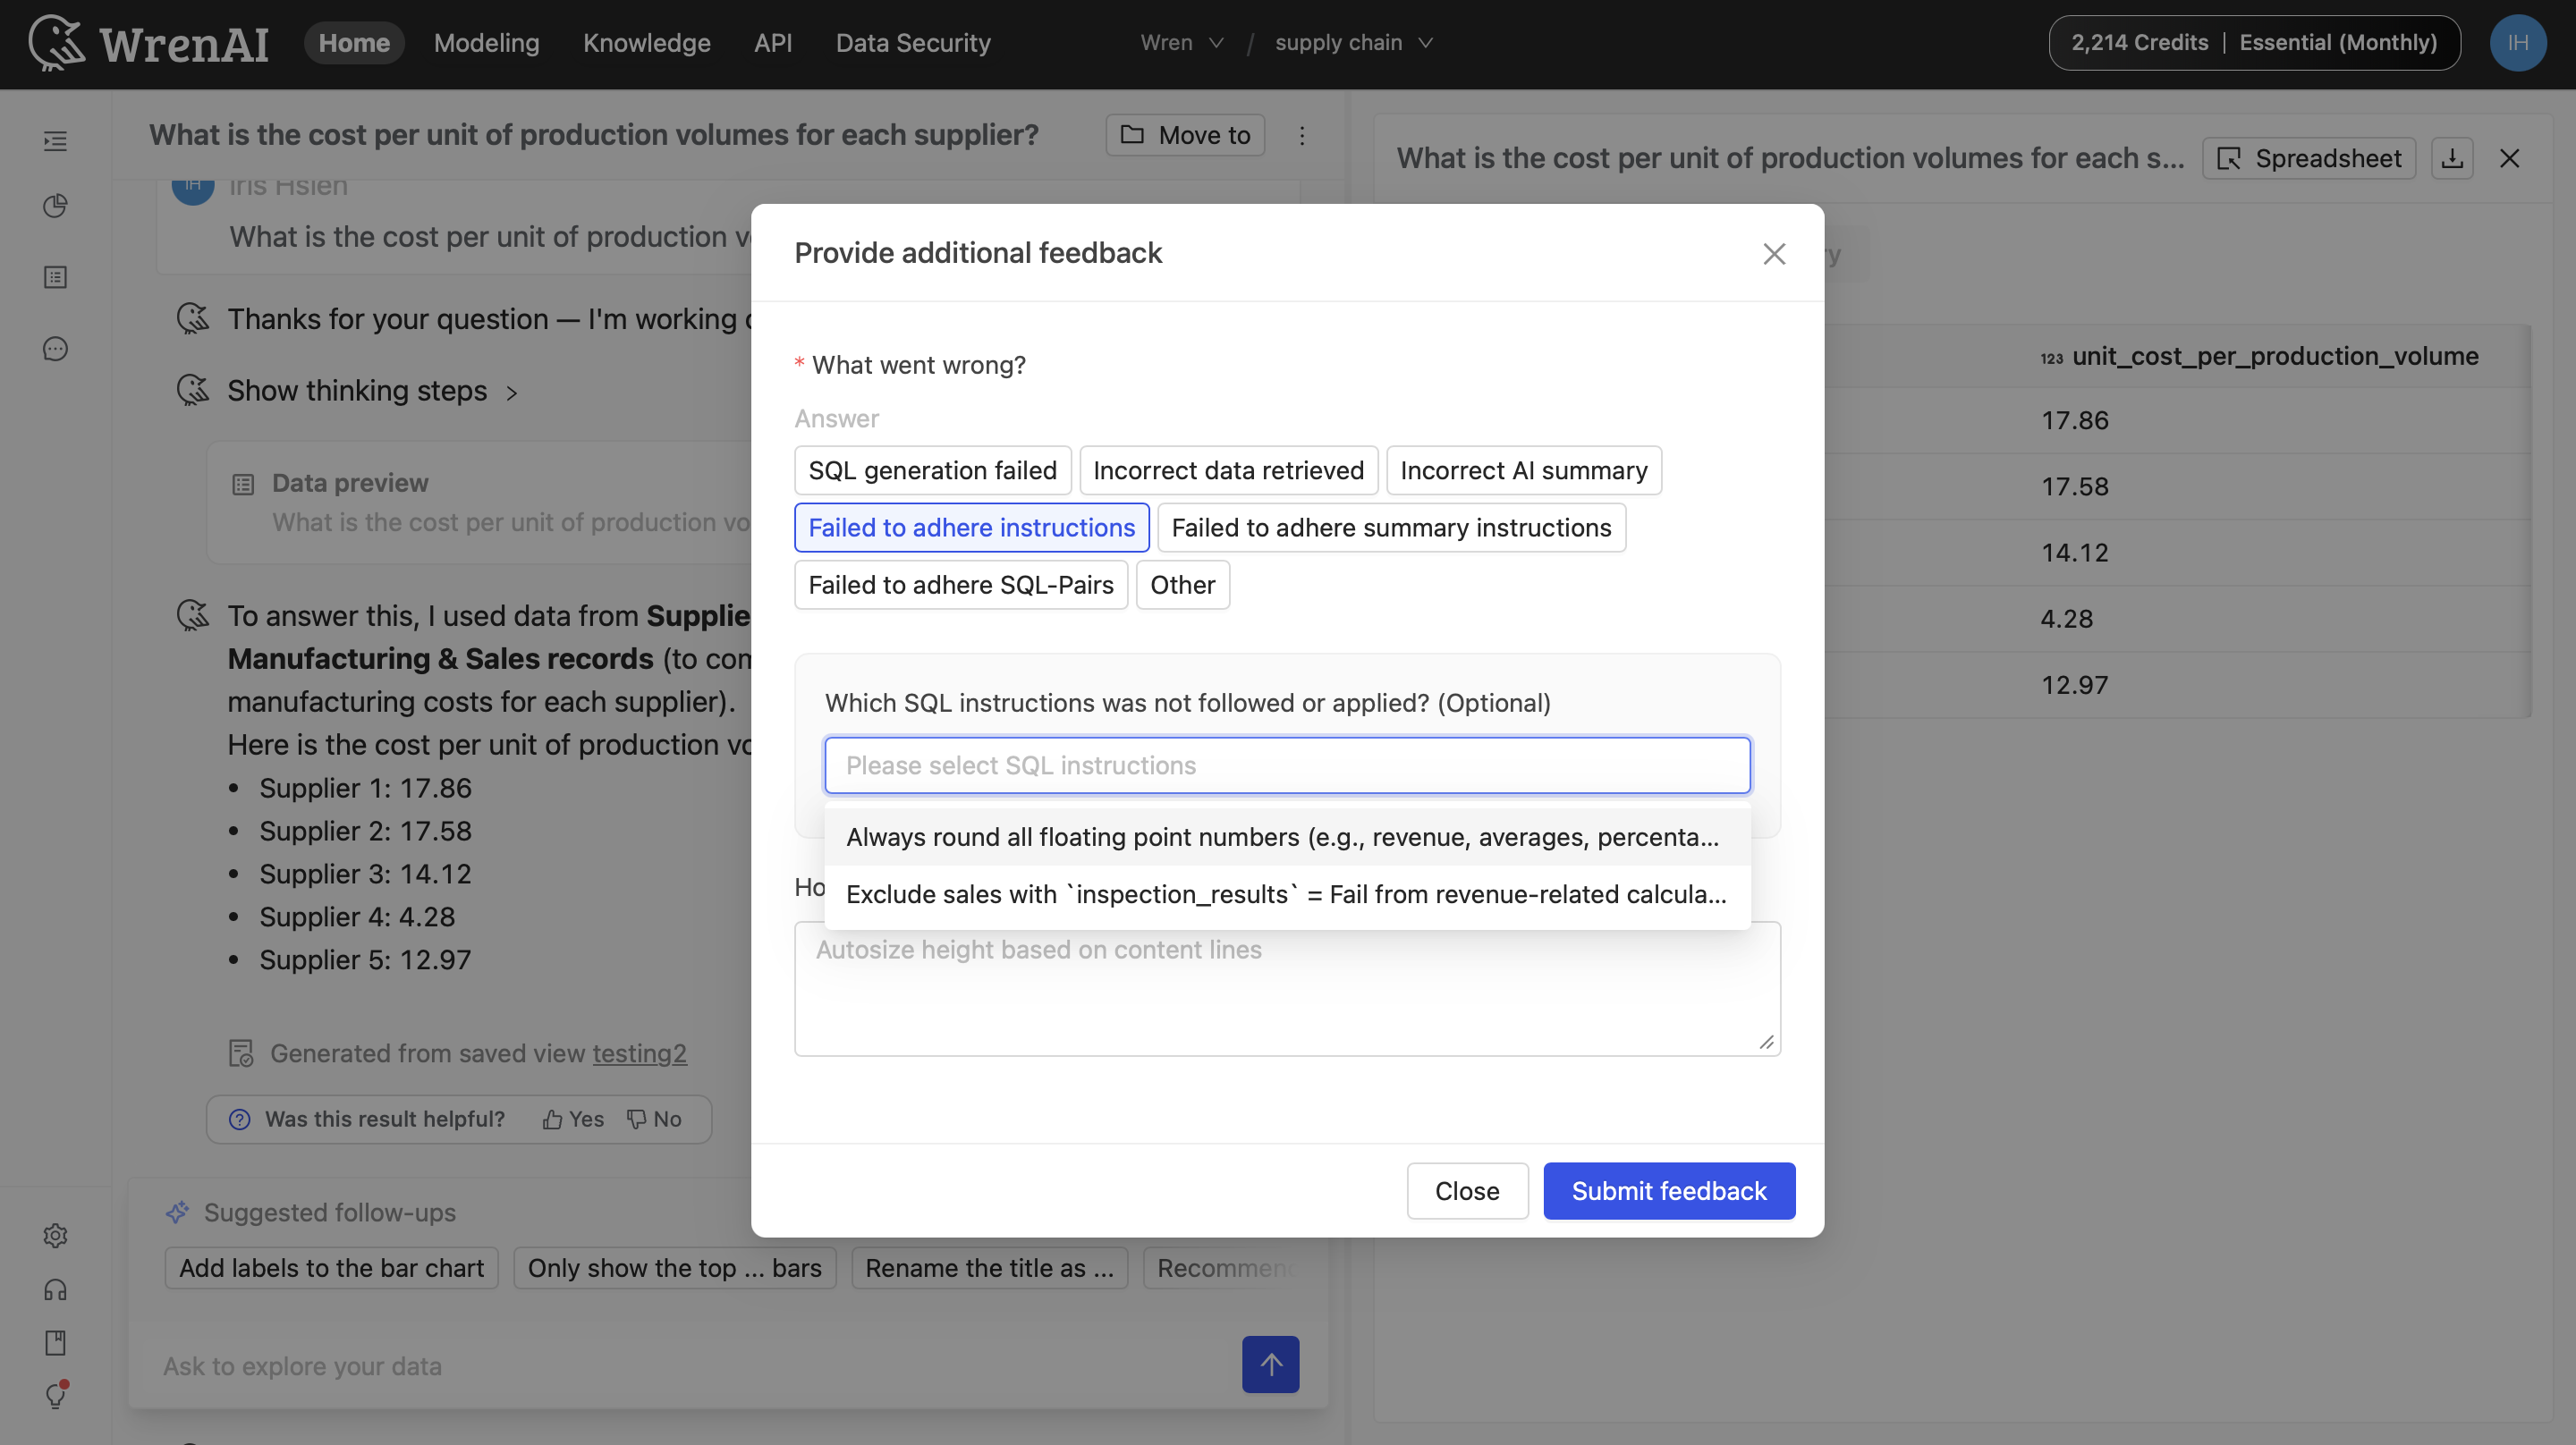
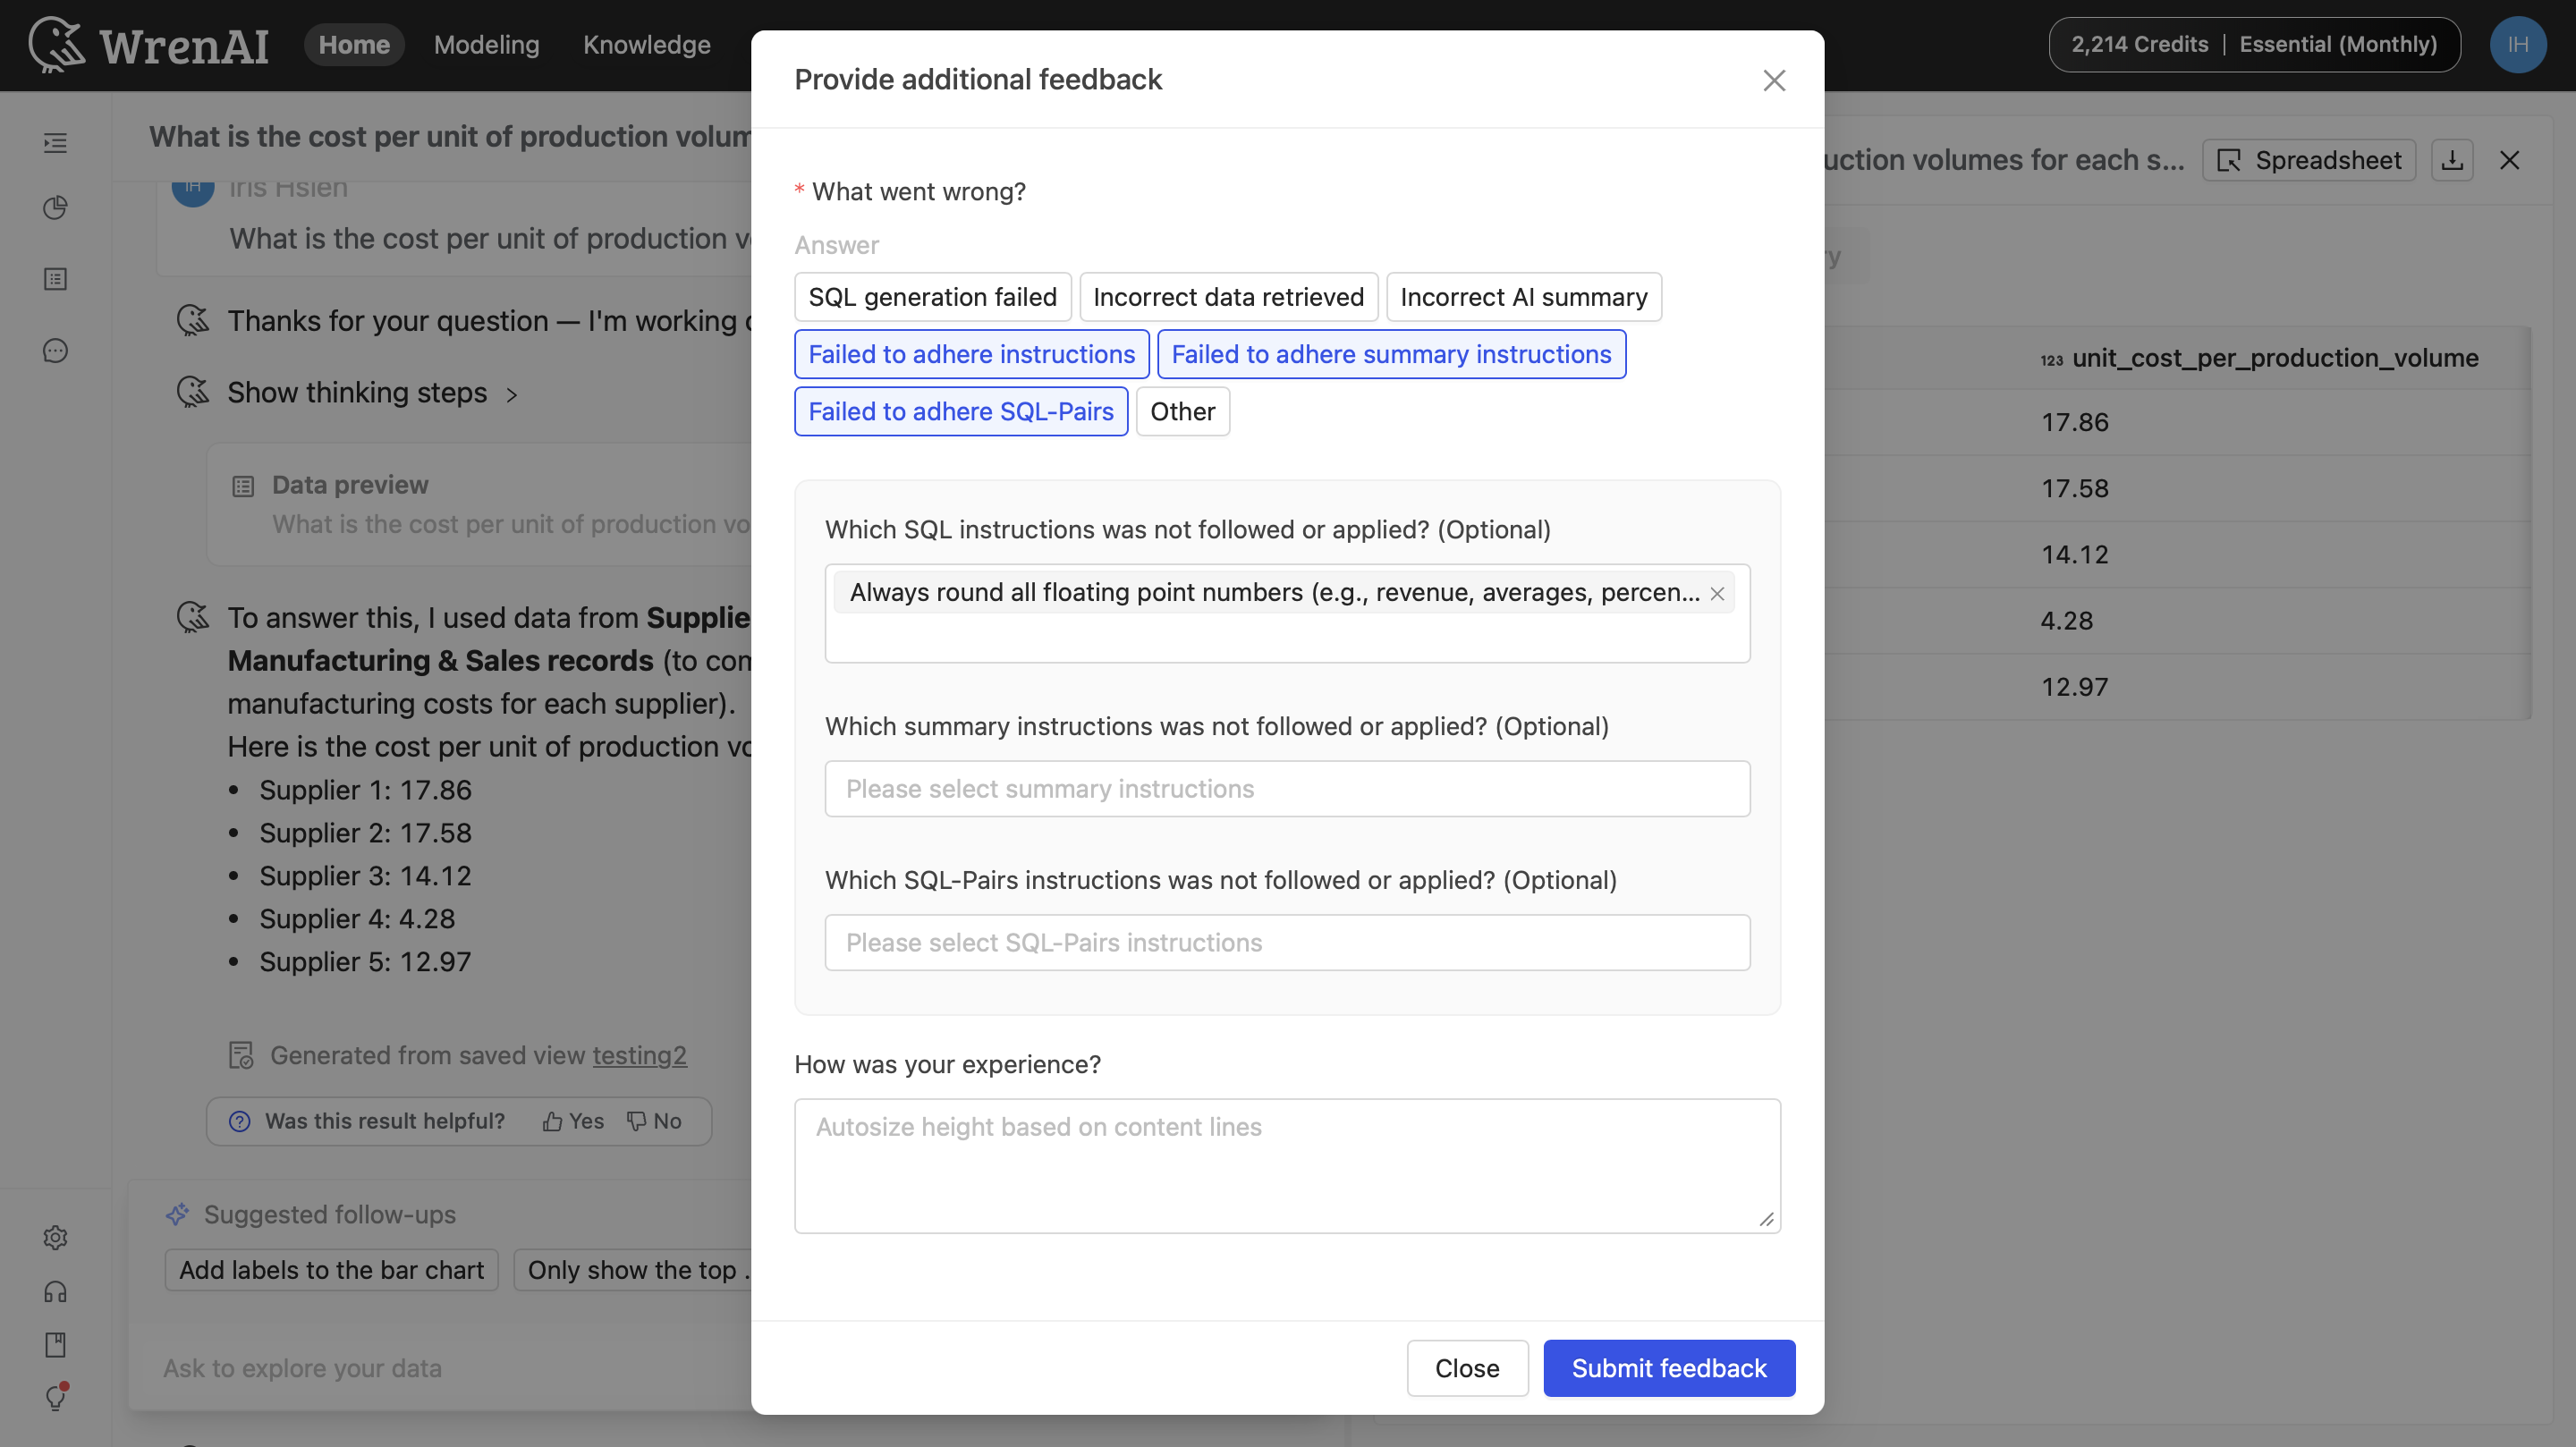
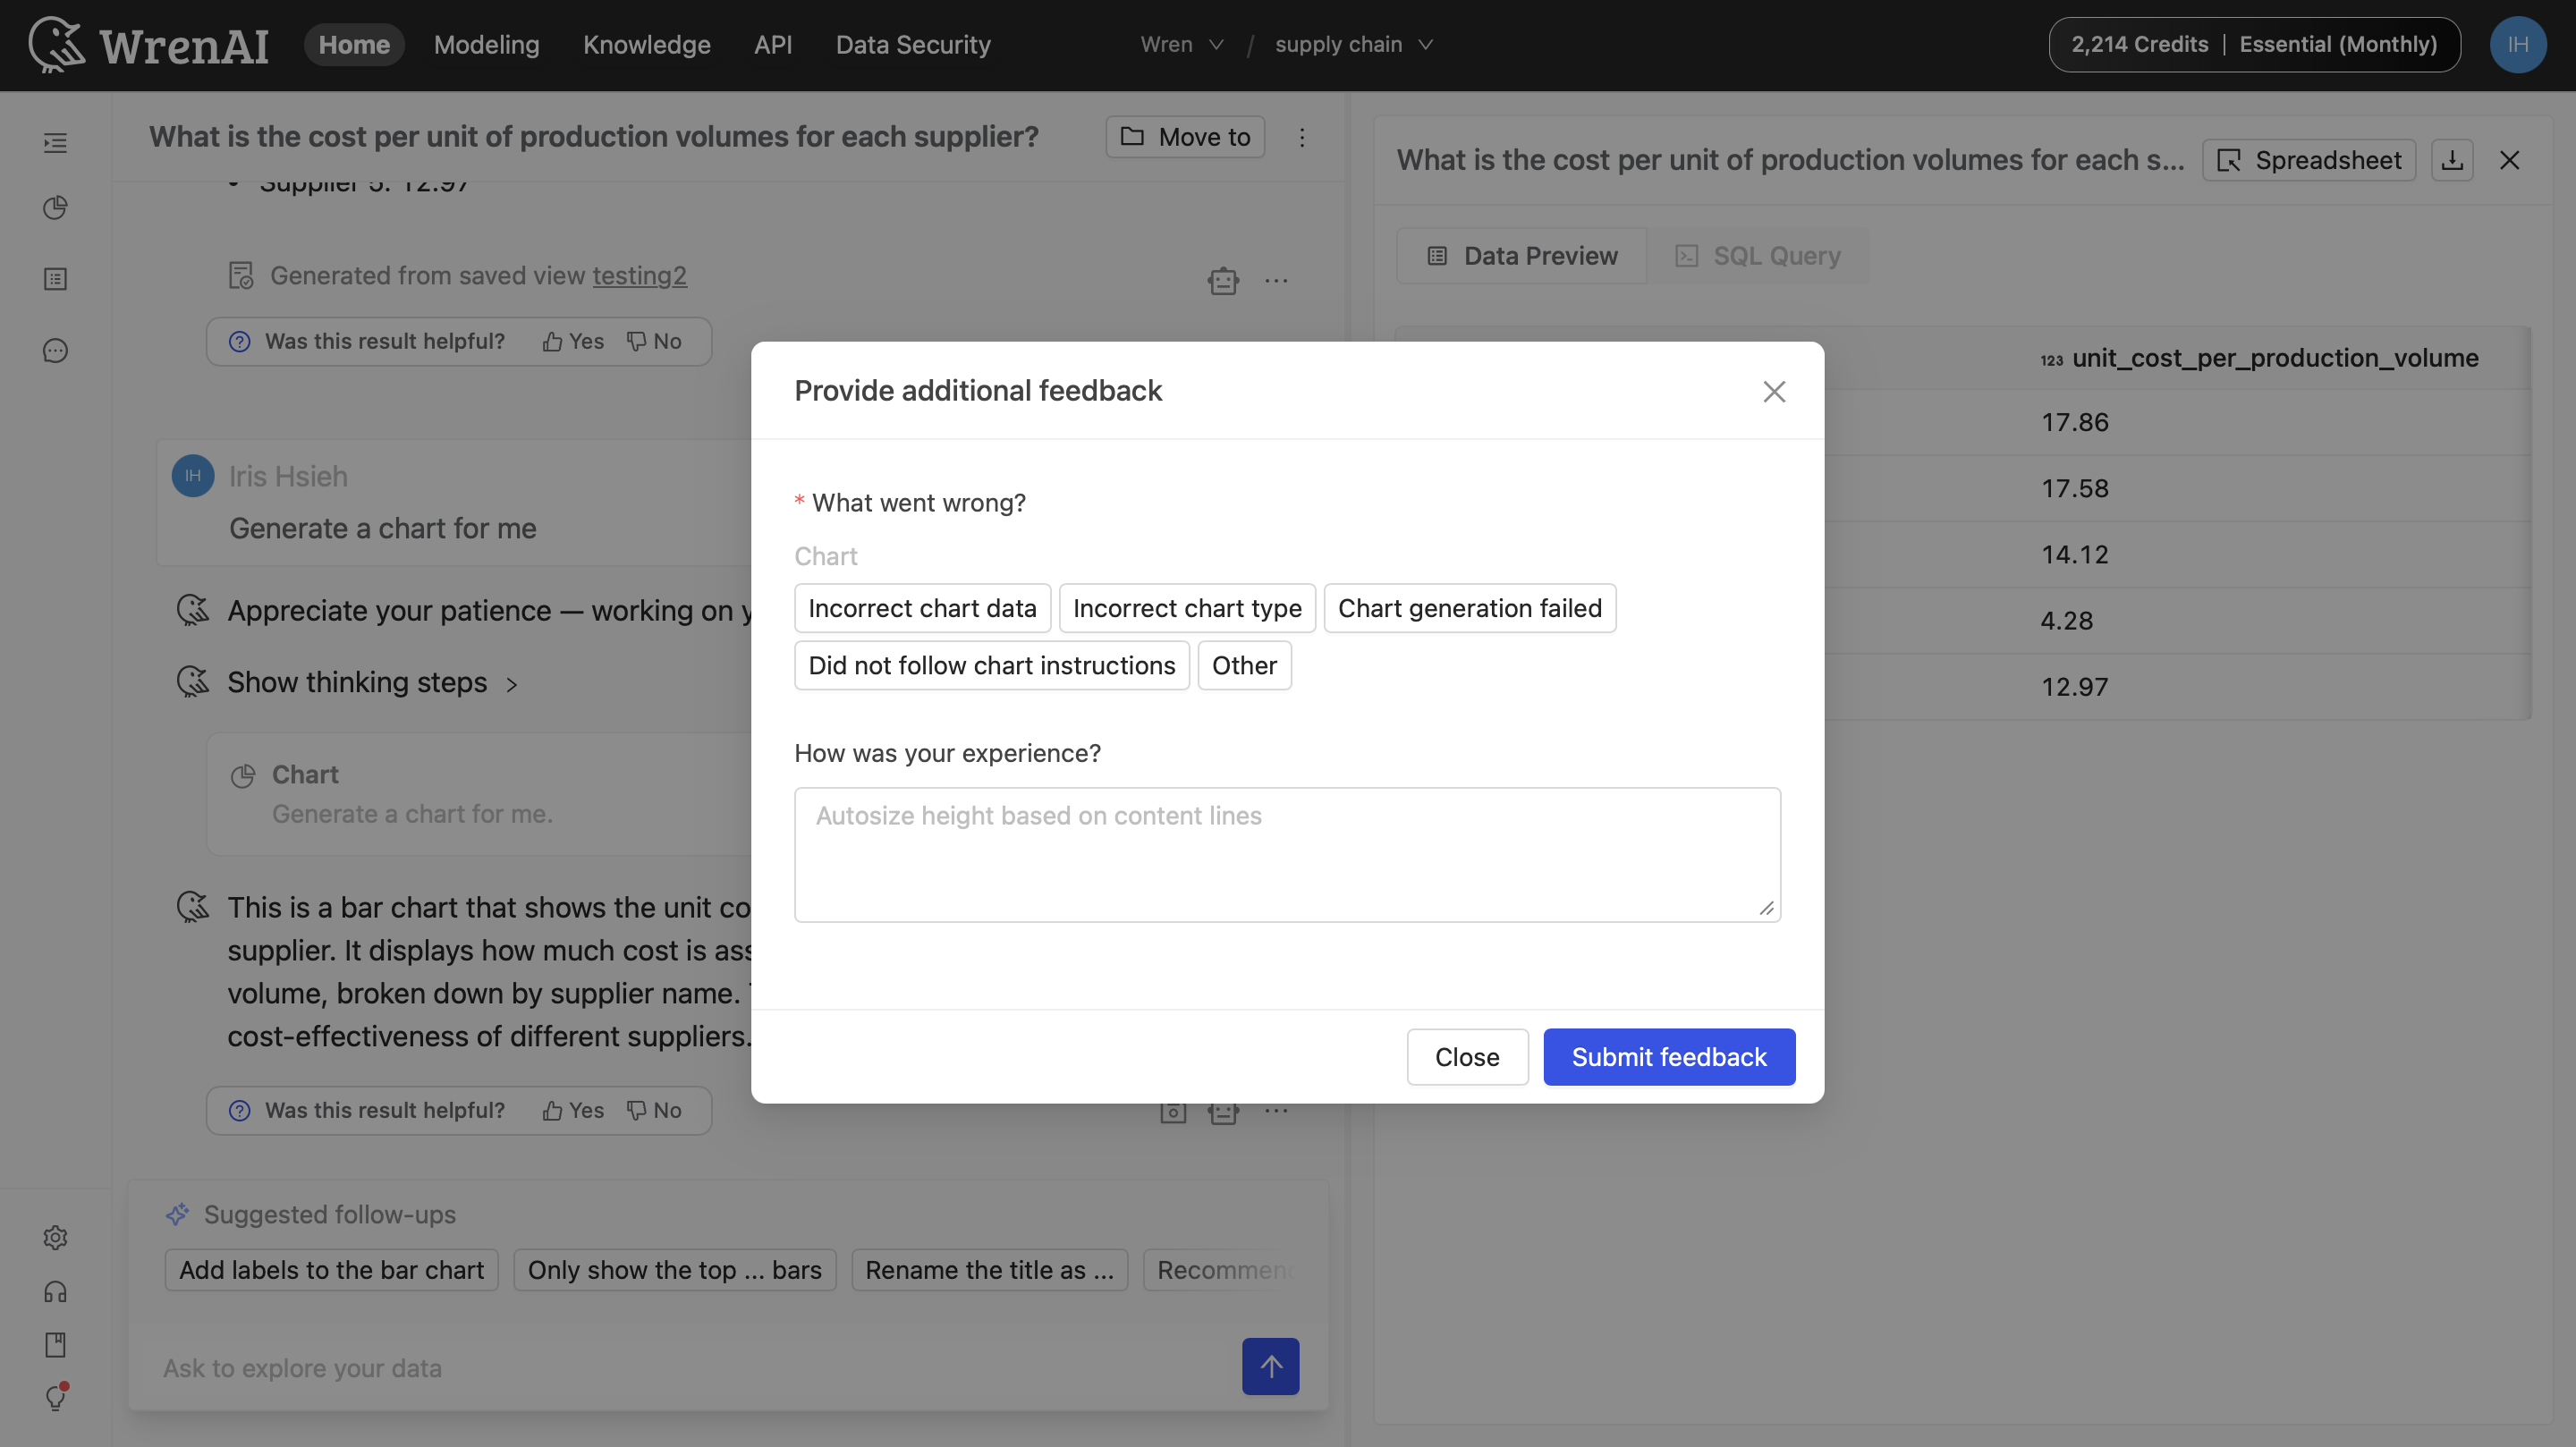
Chart visualization feedback
When you provide feedback on a chart, you’ll see chart-specific issue tags (for example, incorrect chart data or chart generation failed).
Monitor quality as a Project Owner
Project Owners can review aggregated feedback in Settings → Project → Thread tracing:
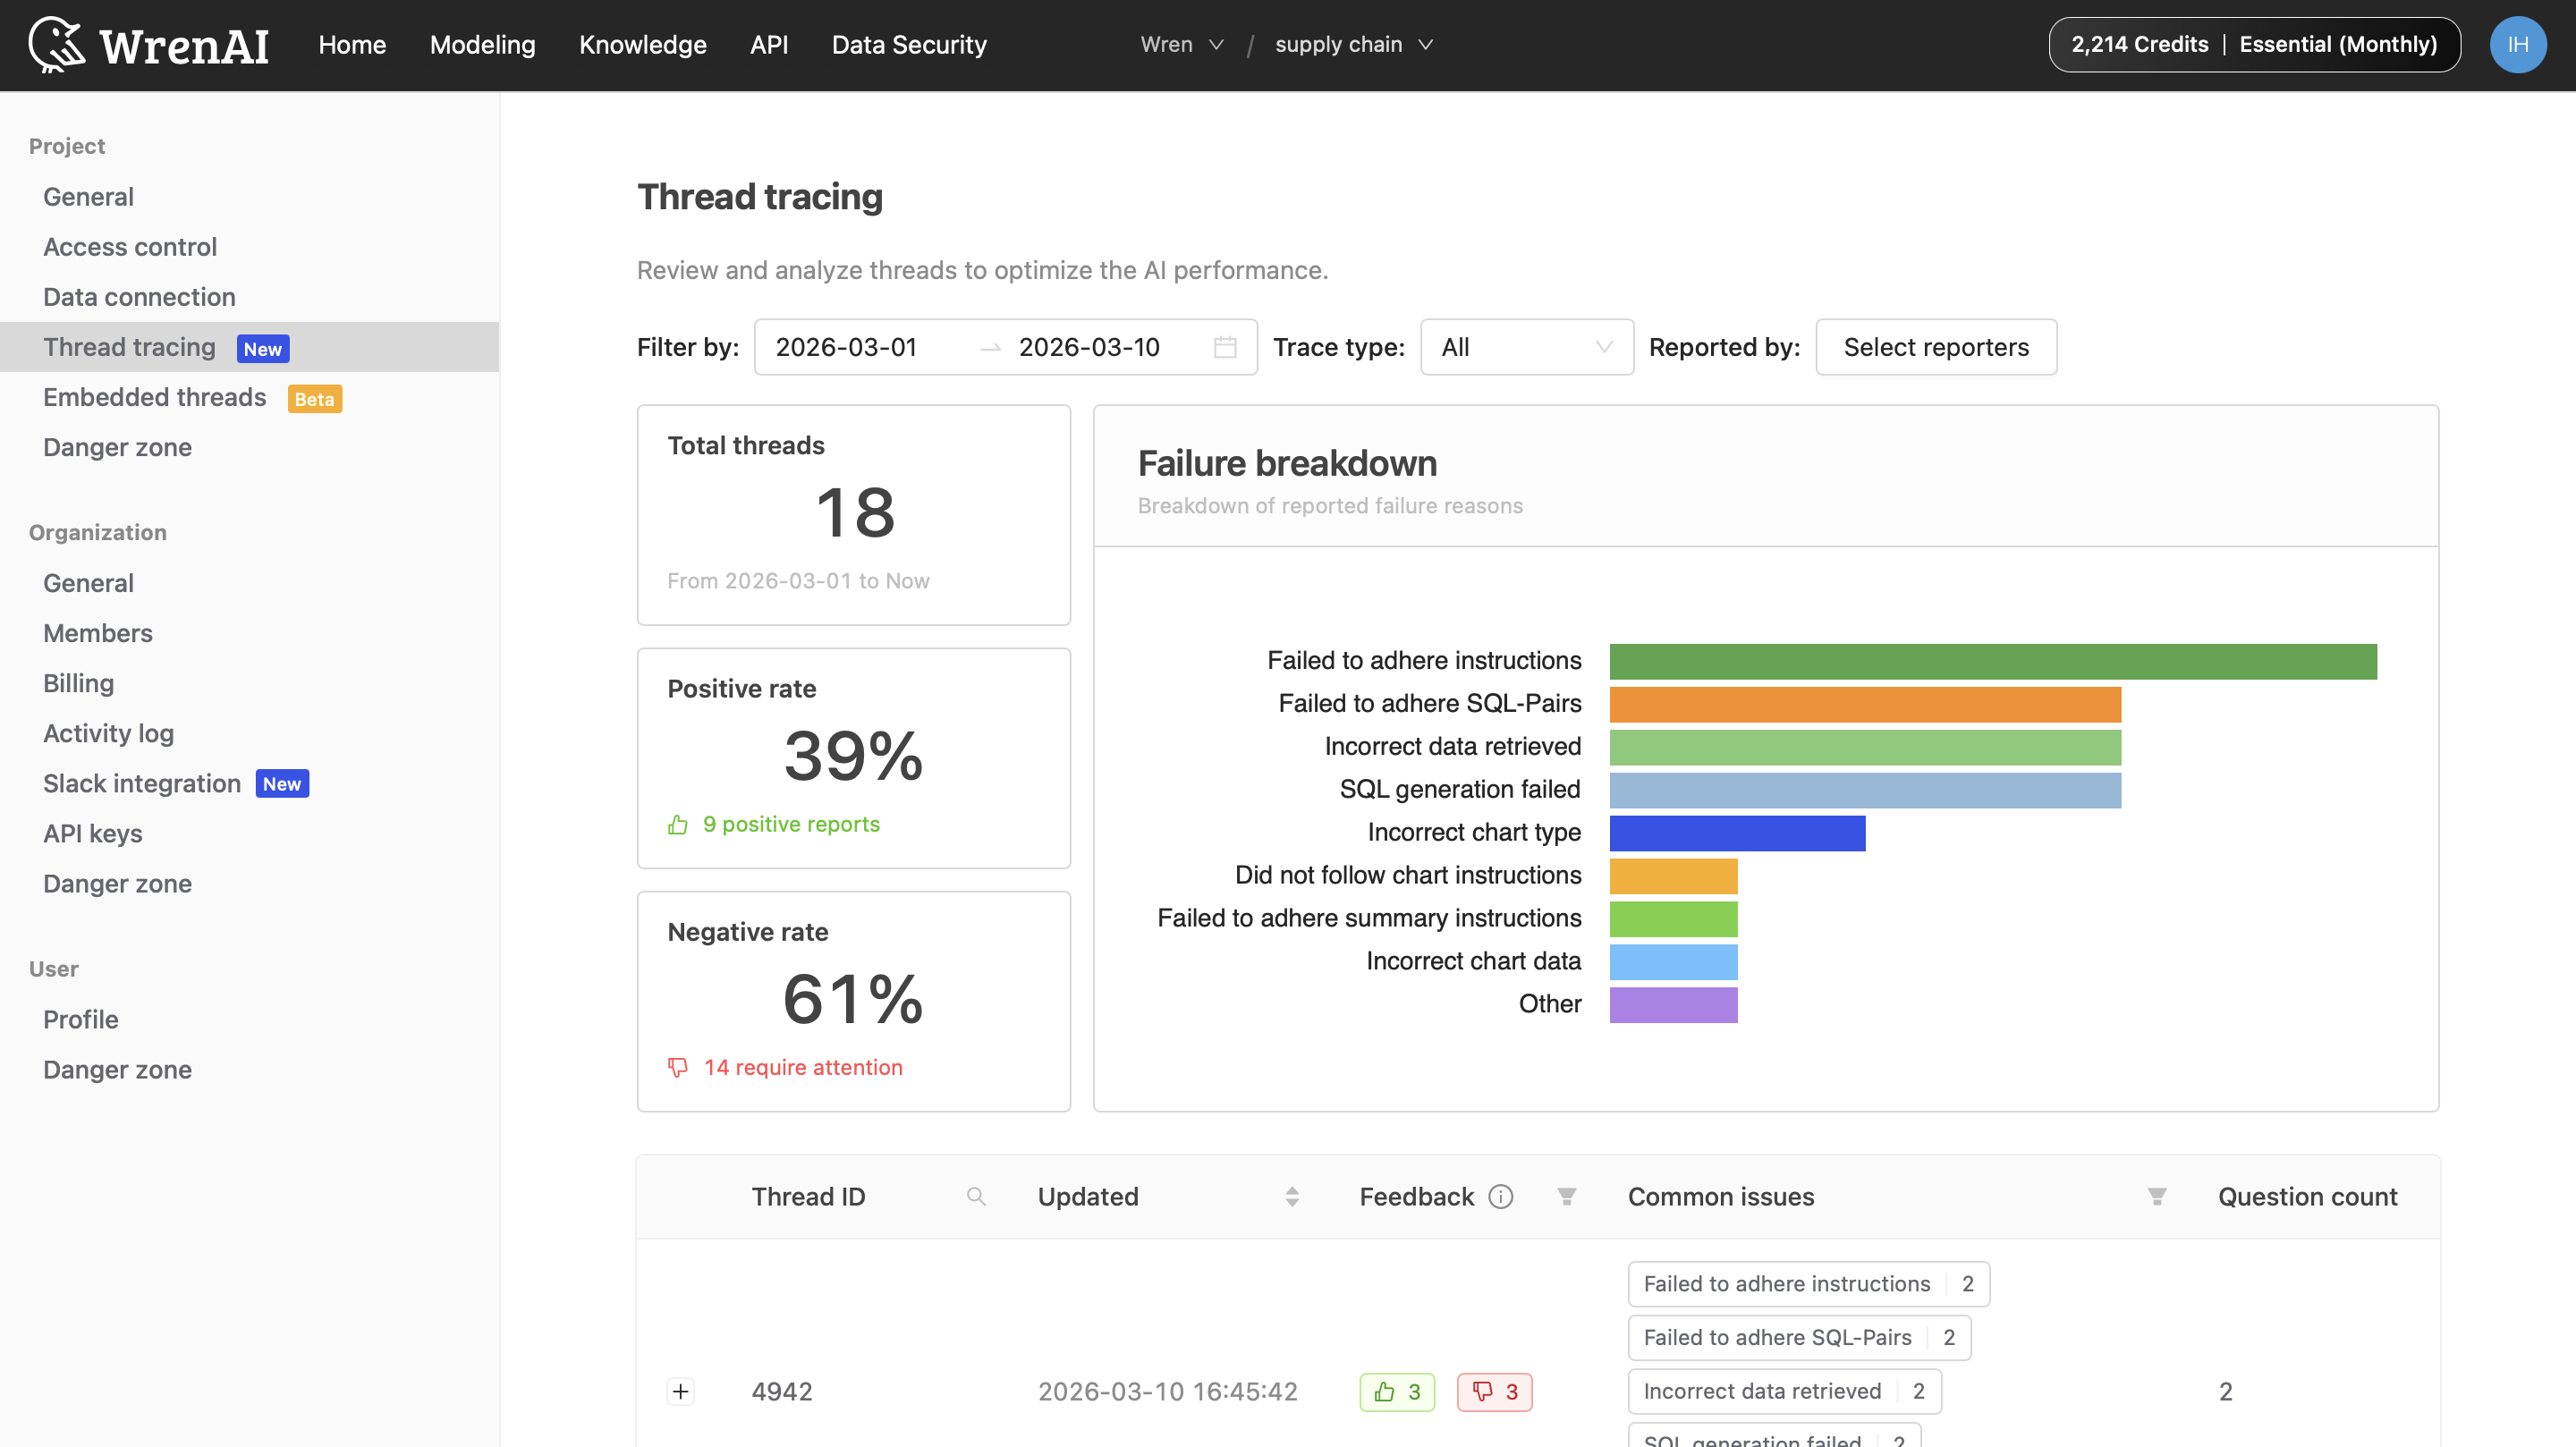
- Success metrics: Track Positive rate vs. Negative rate to monitor satisfaction over time.
- Failure breakdown: Use the bar chart to see which categories (for example, “SQL generation failed” vs. “Incorrect AI summary”) occur most often.
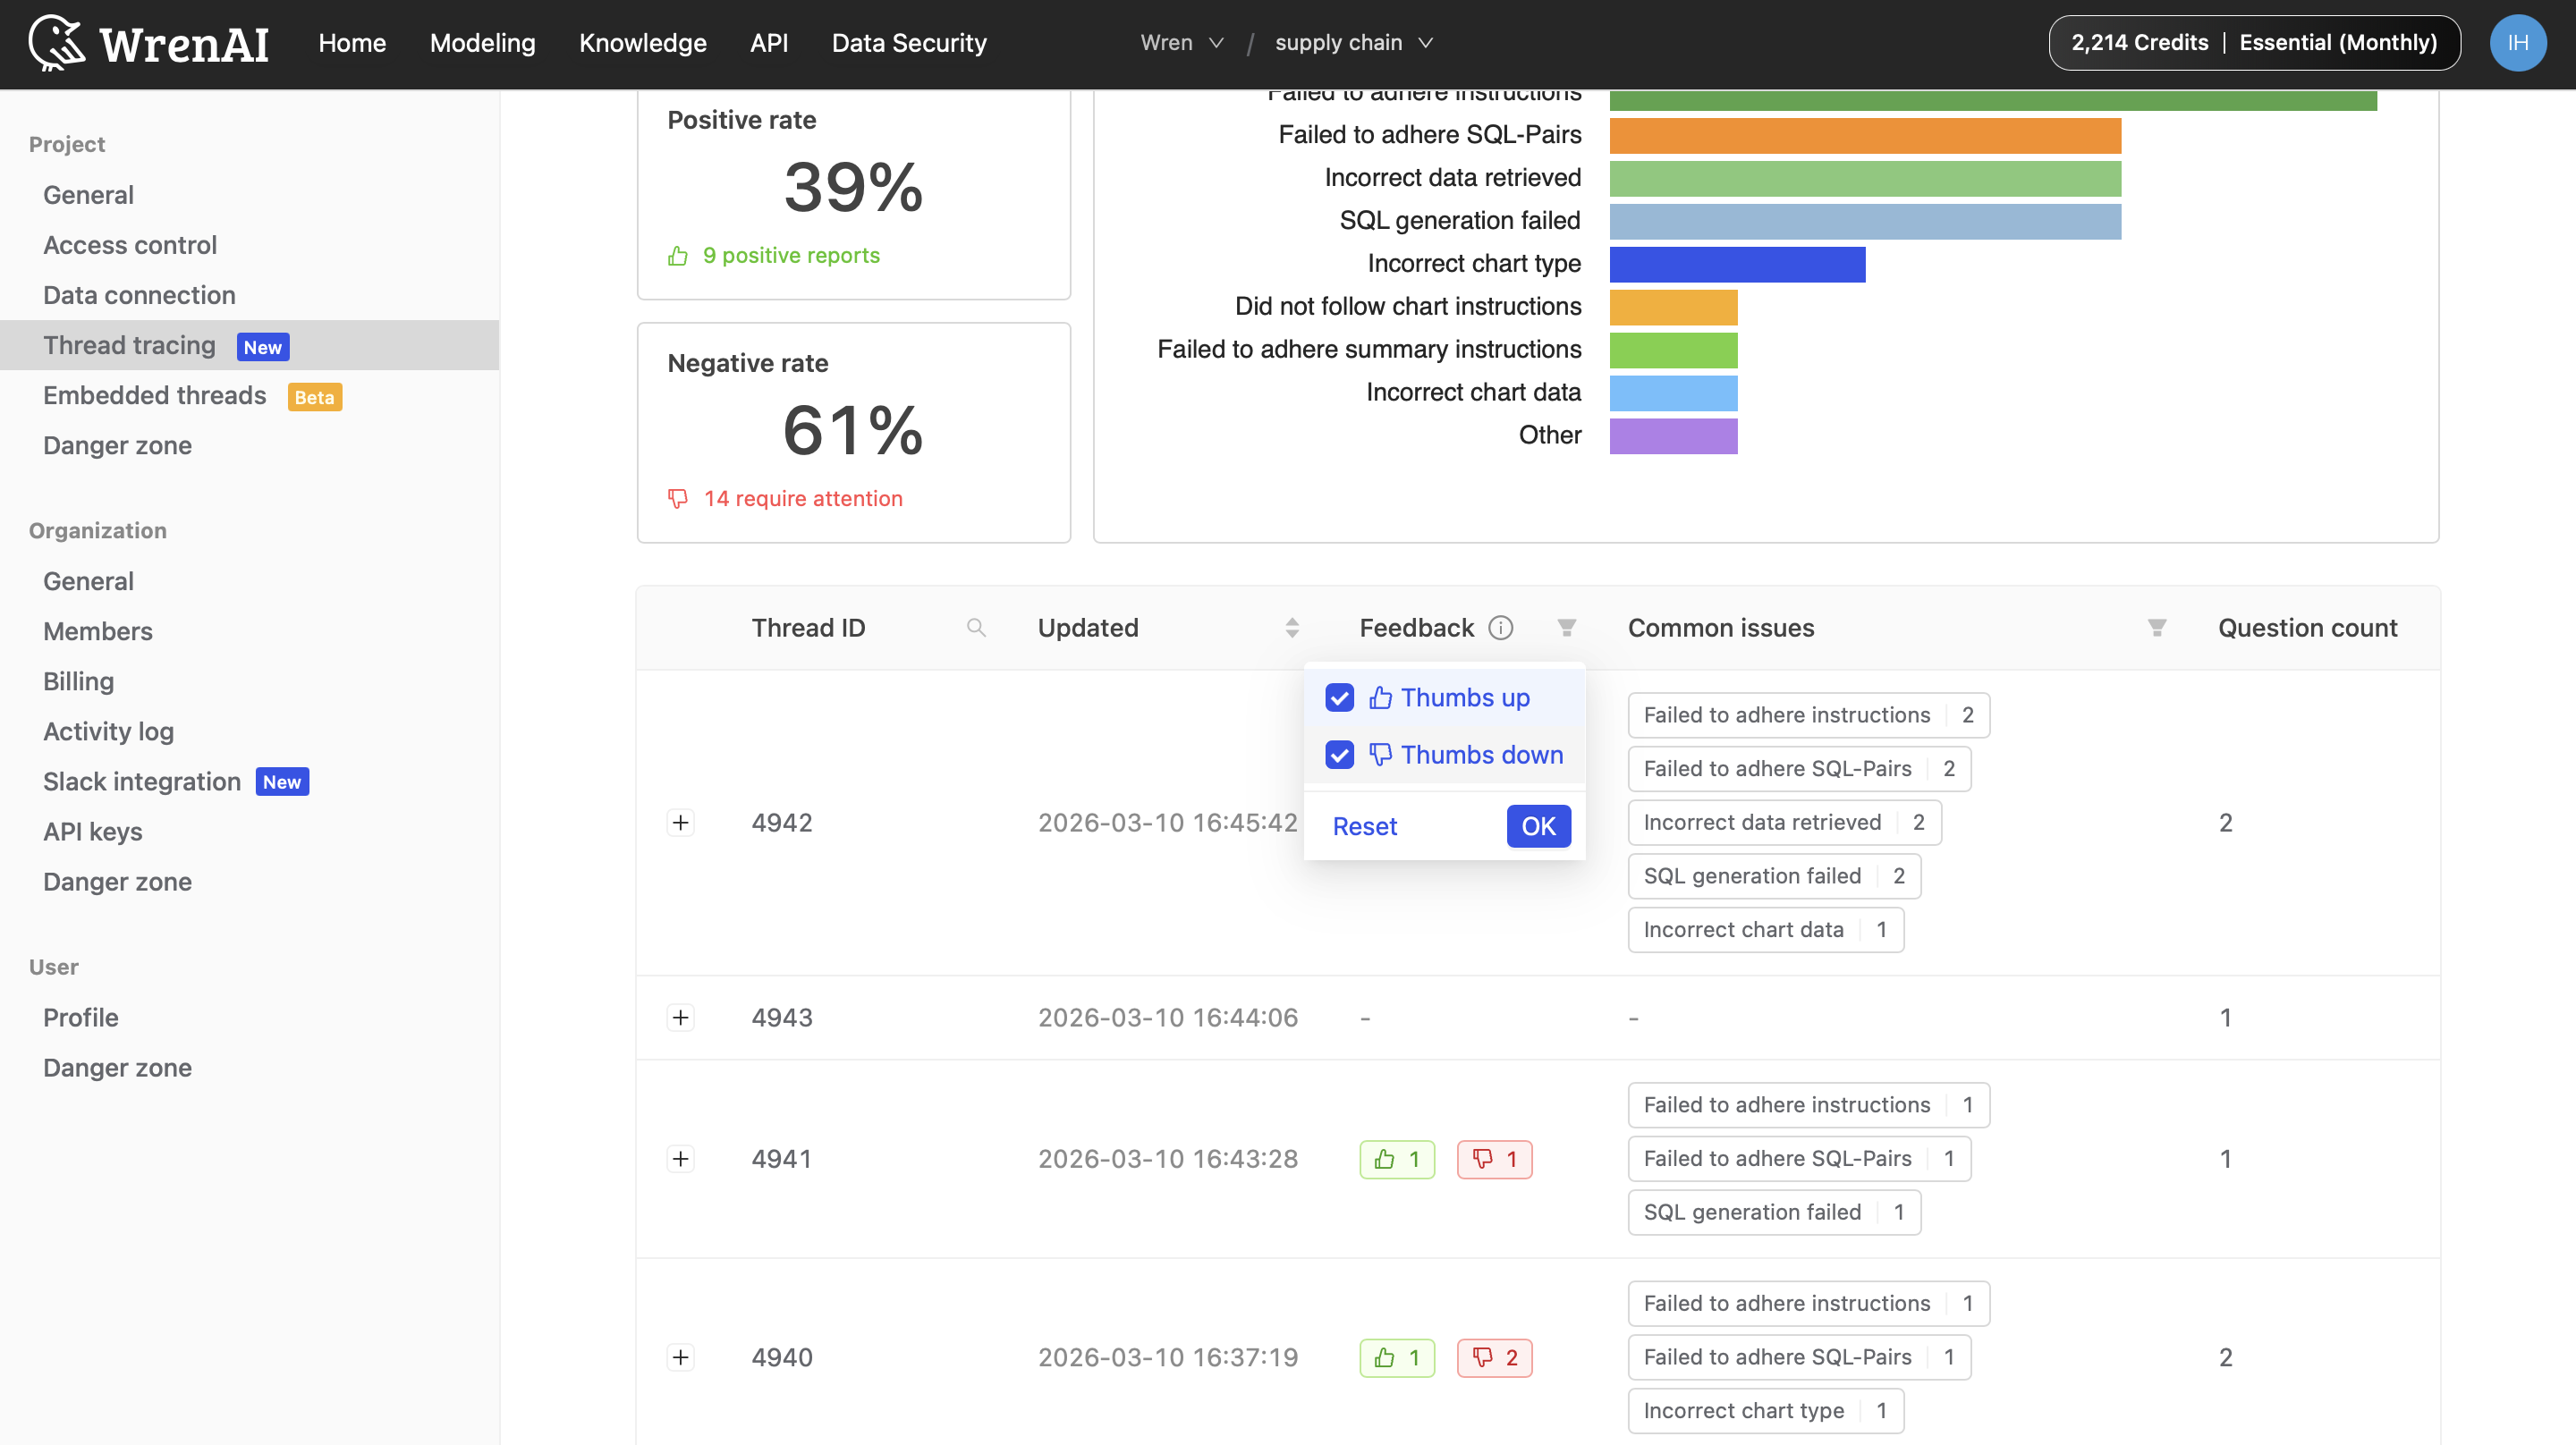
- Thread overview table: See all threads that have been created in the project. Use table filters to quickly narrow down to threads with feedback only when you want to focus on issues that users have explicitly reported.
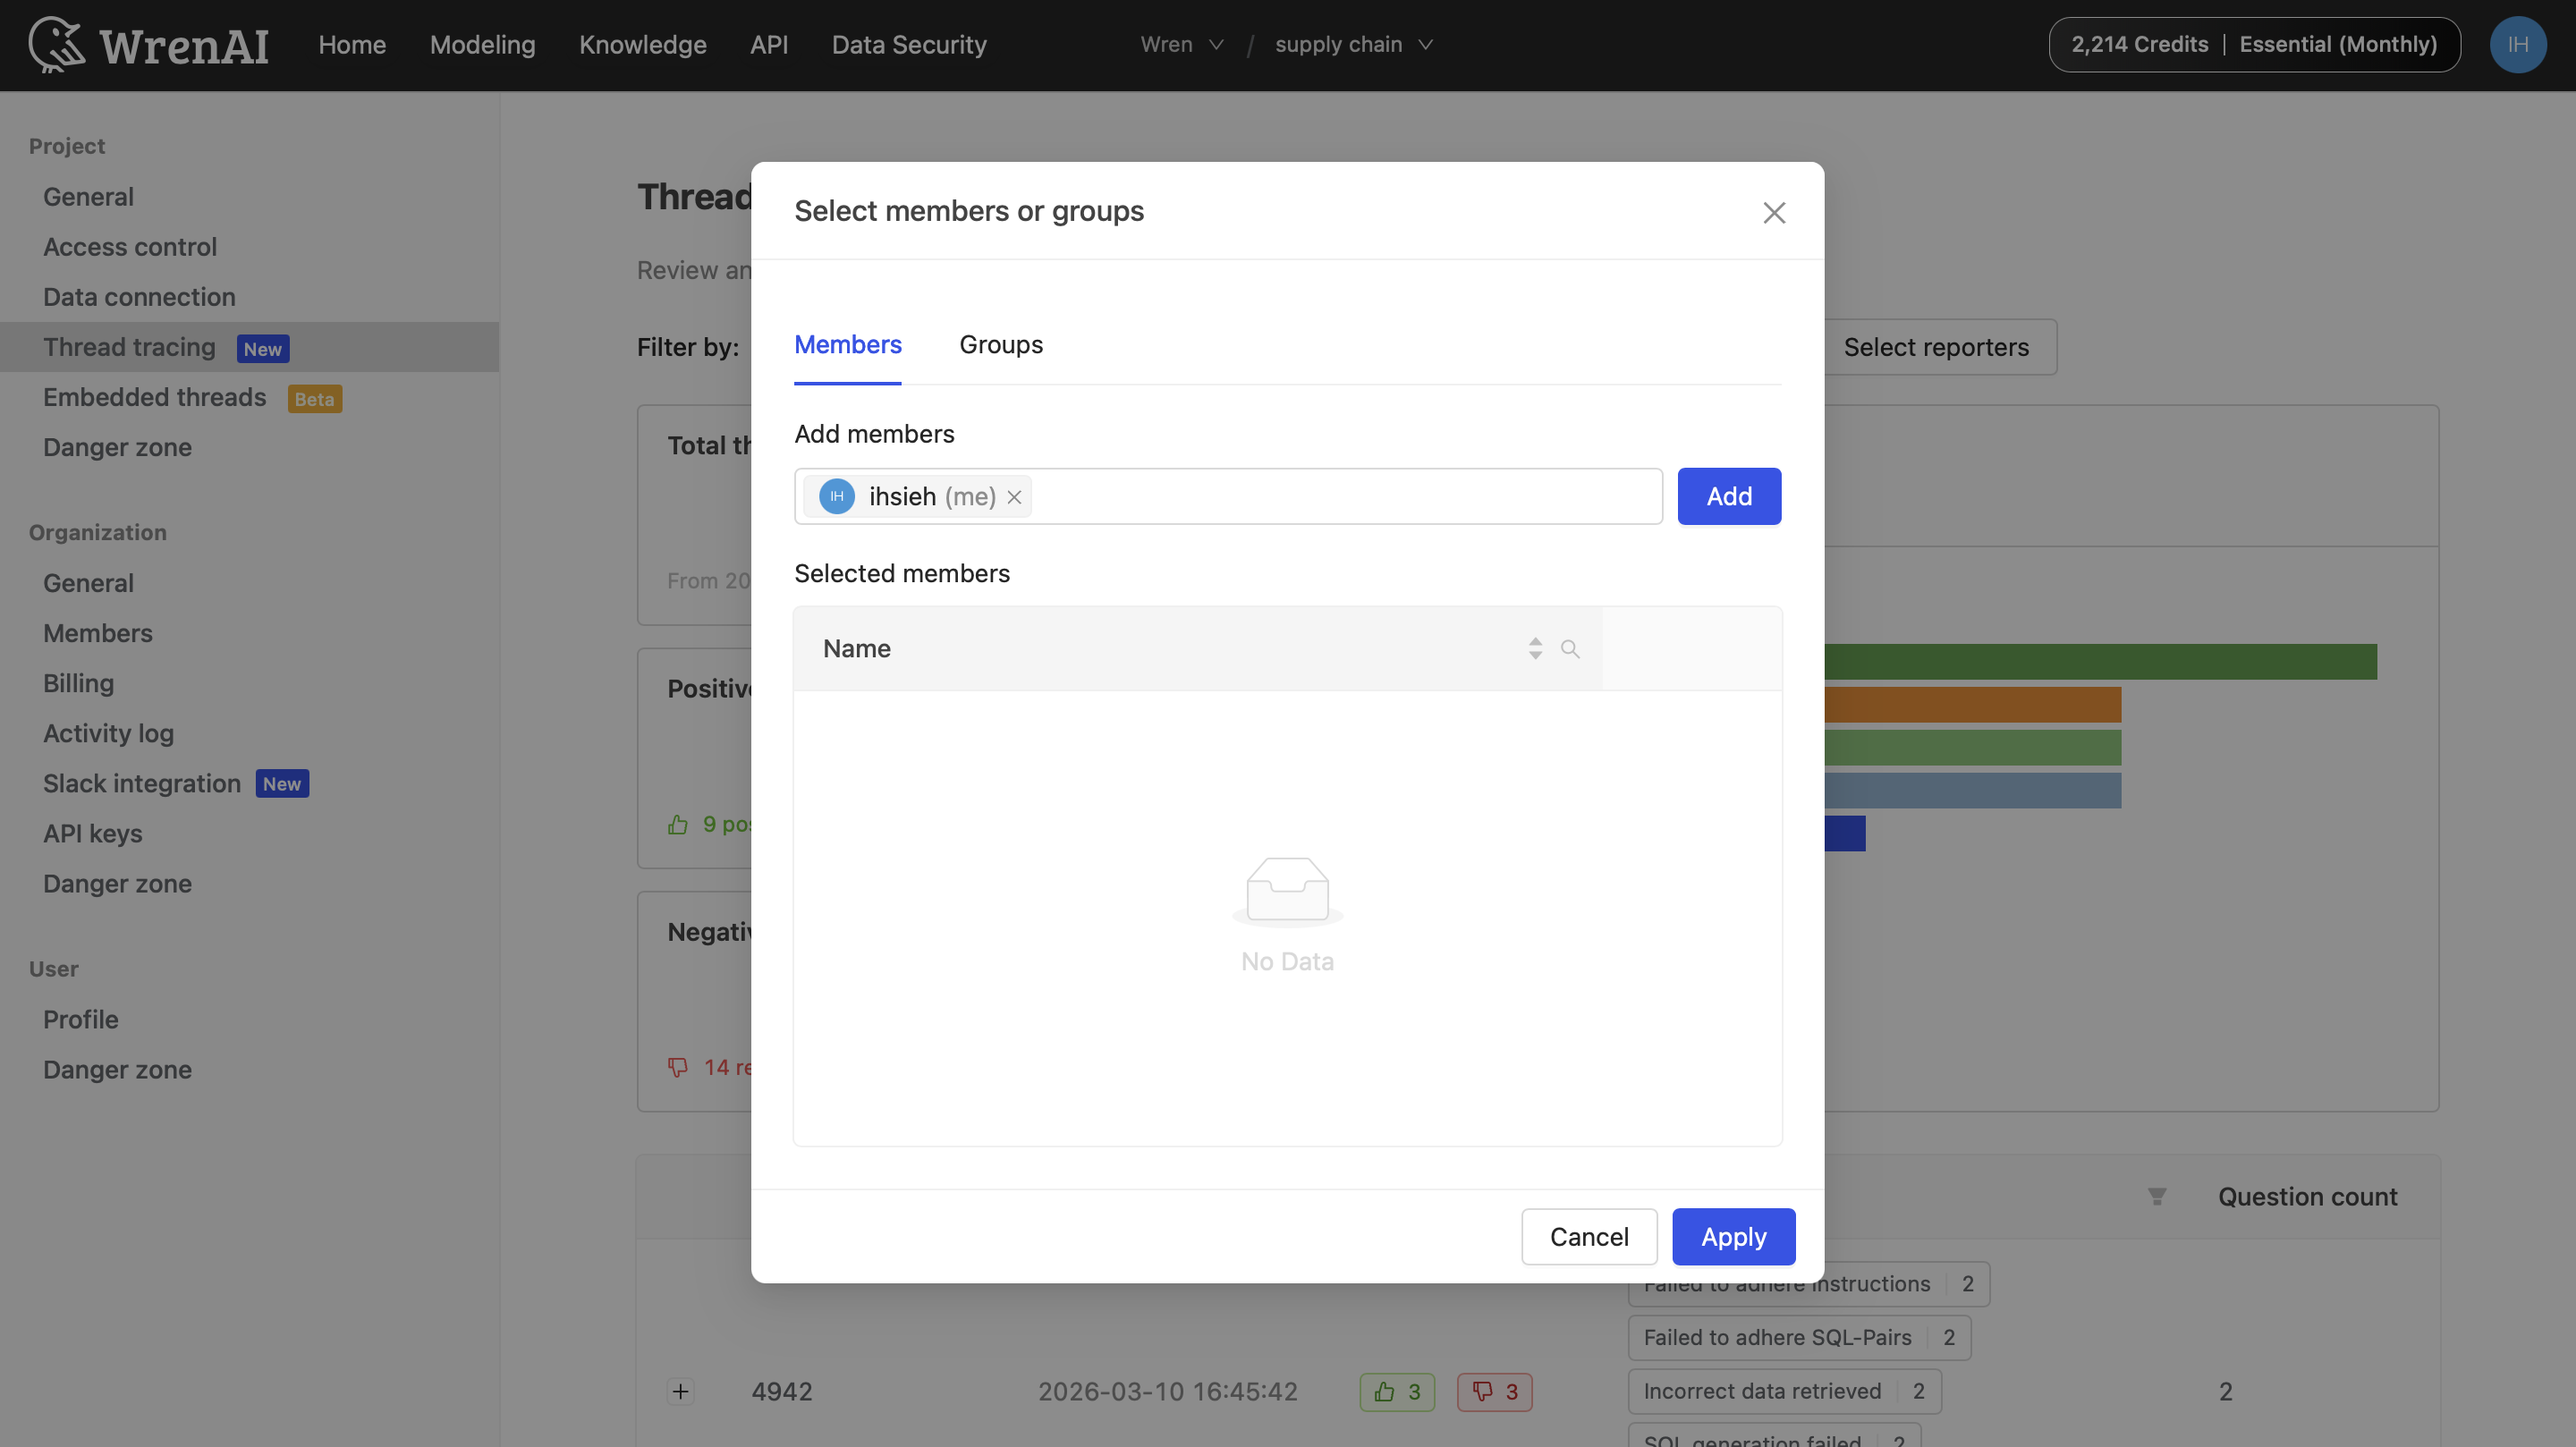
- Advanced filtering:
- Filter by date range or trace type (Answer vs. Chart).
- Filter by specific users or groups to compare behavior across teams.
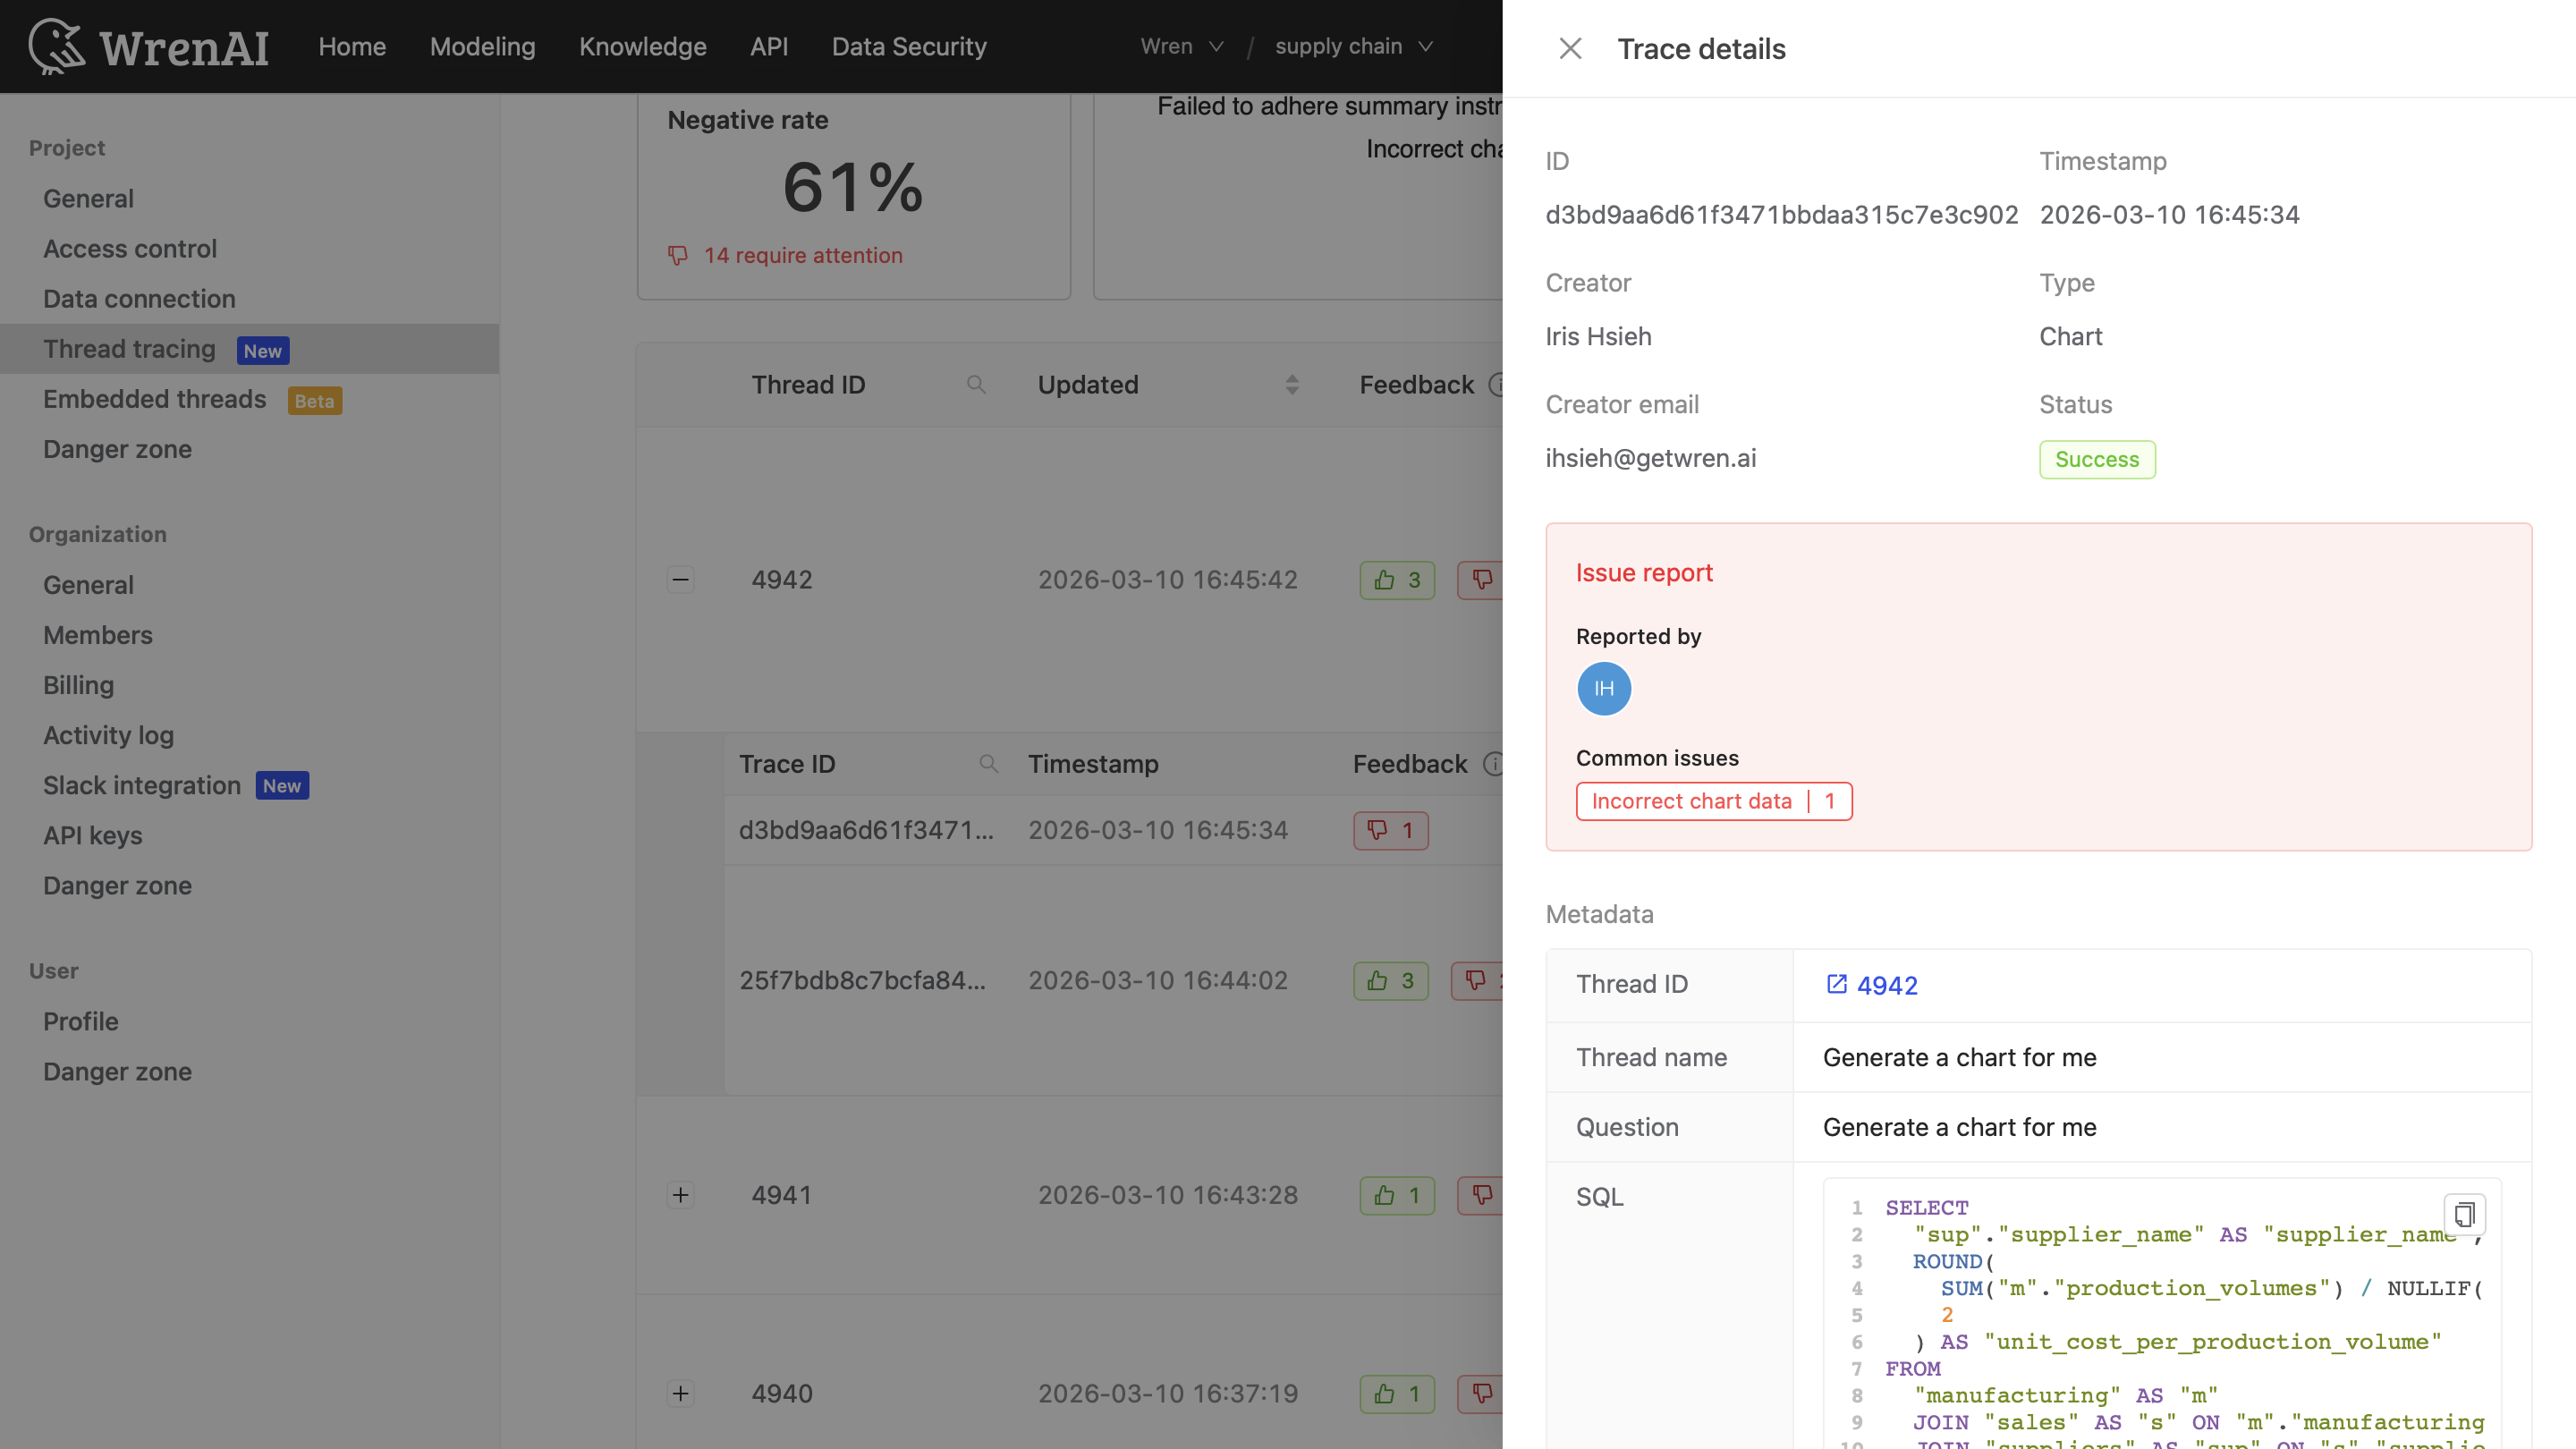
- Deep dive: Expand a Thread ID to view Trace details (Trace ID, timestamp, and the Suggested failure reason) for troubleshooting.
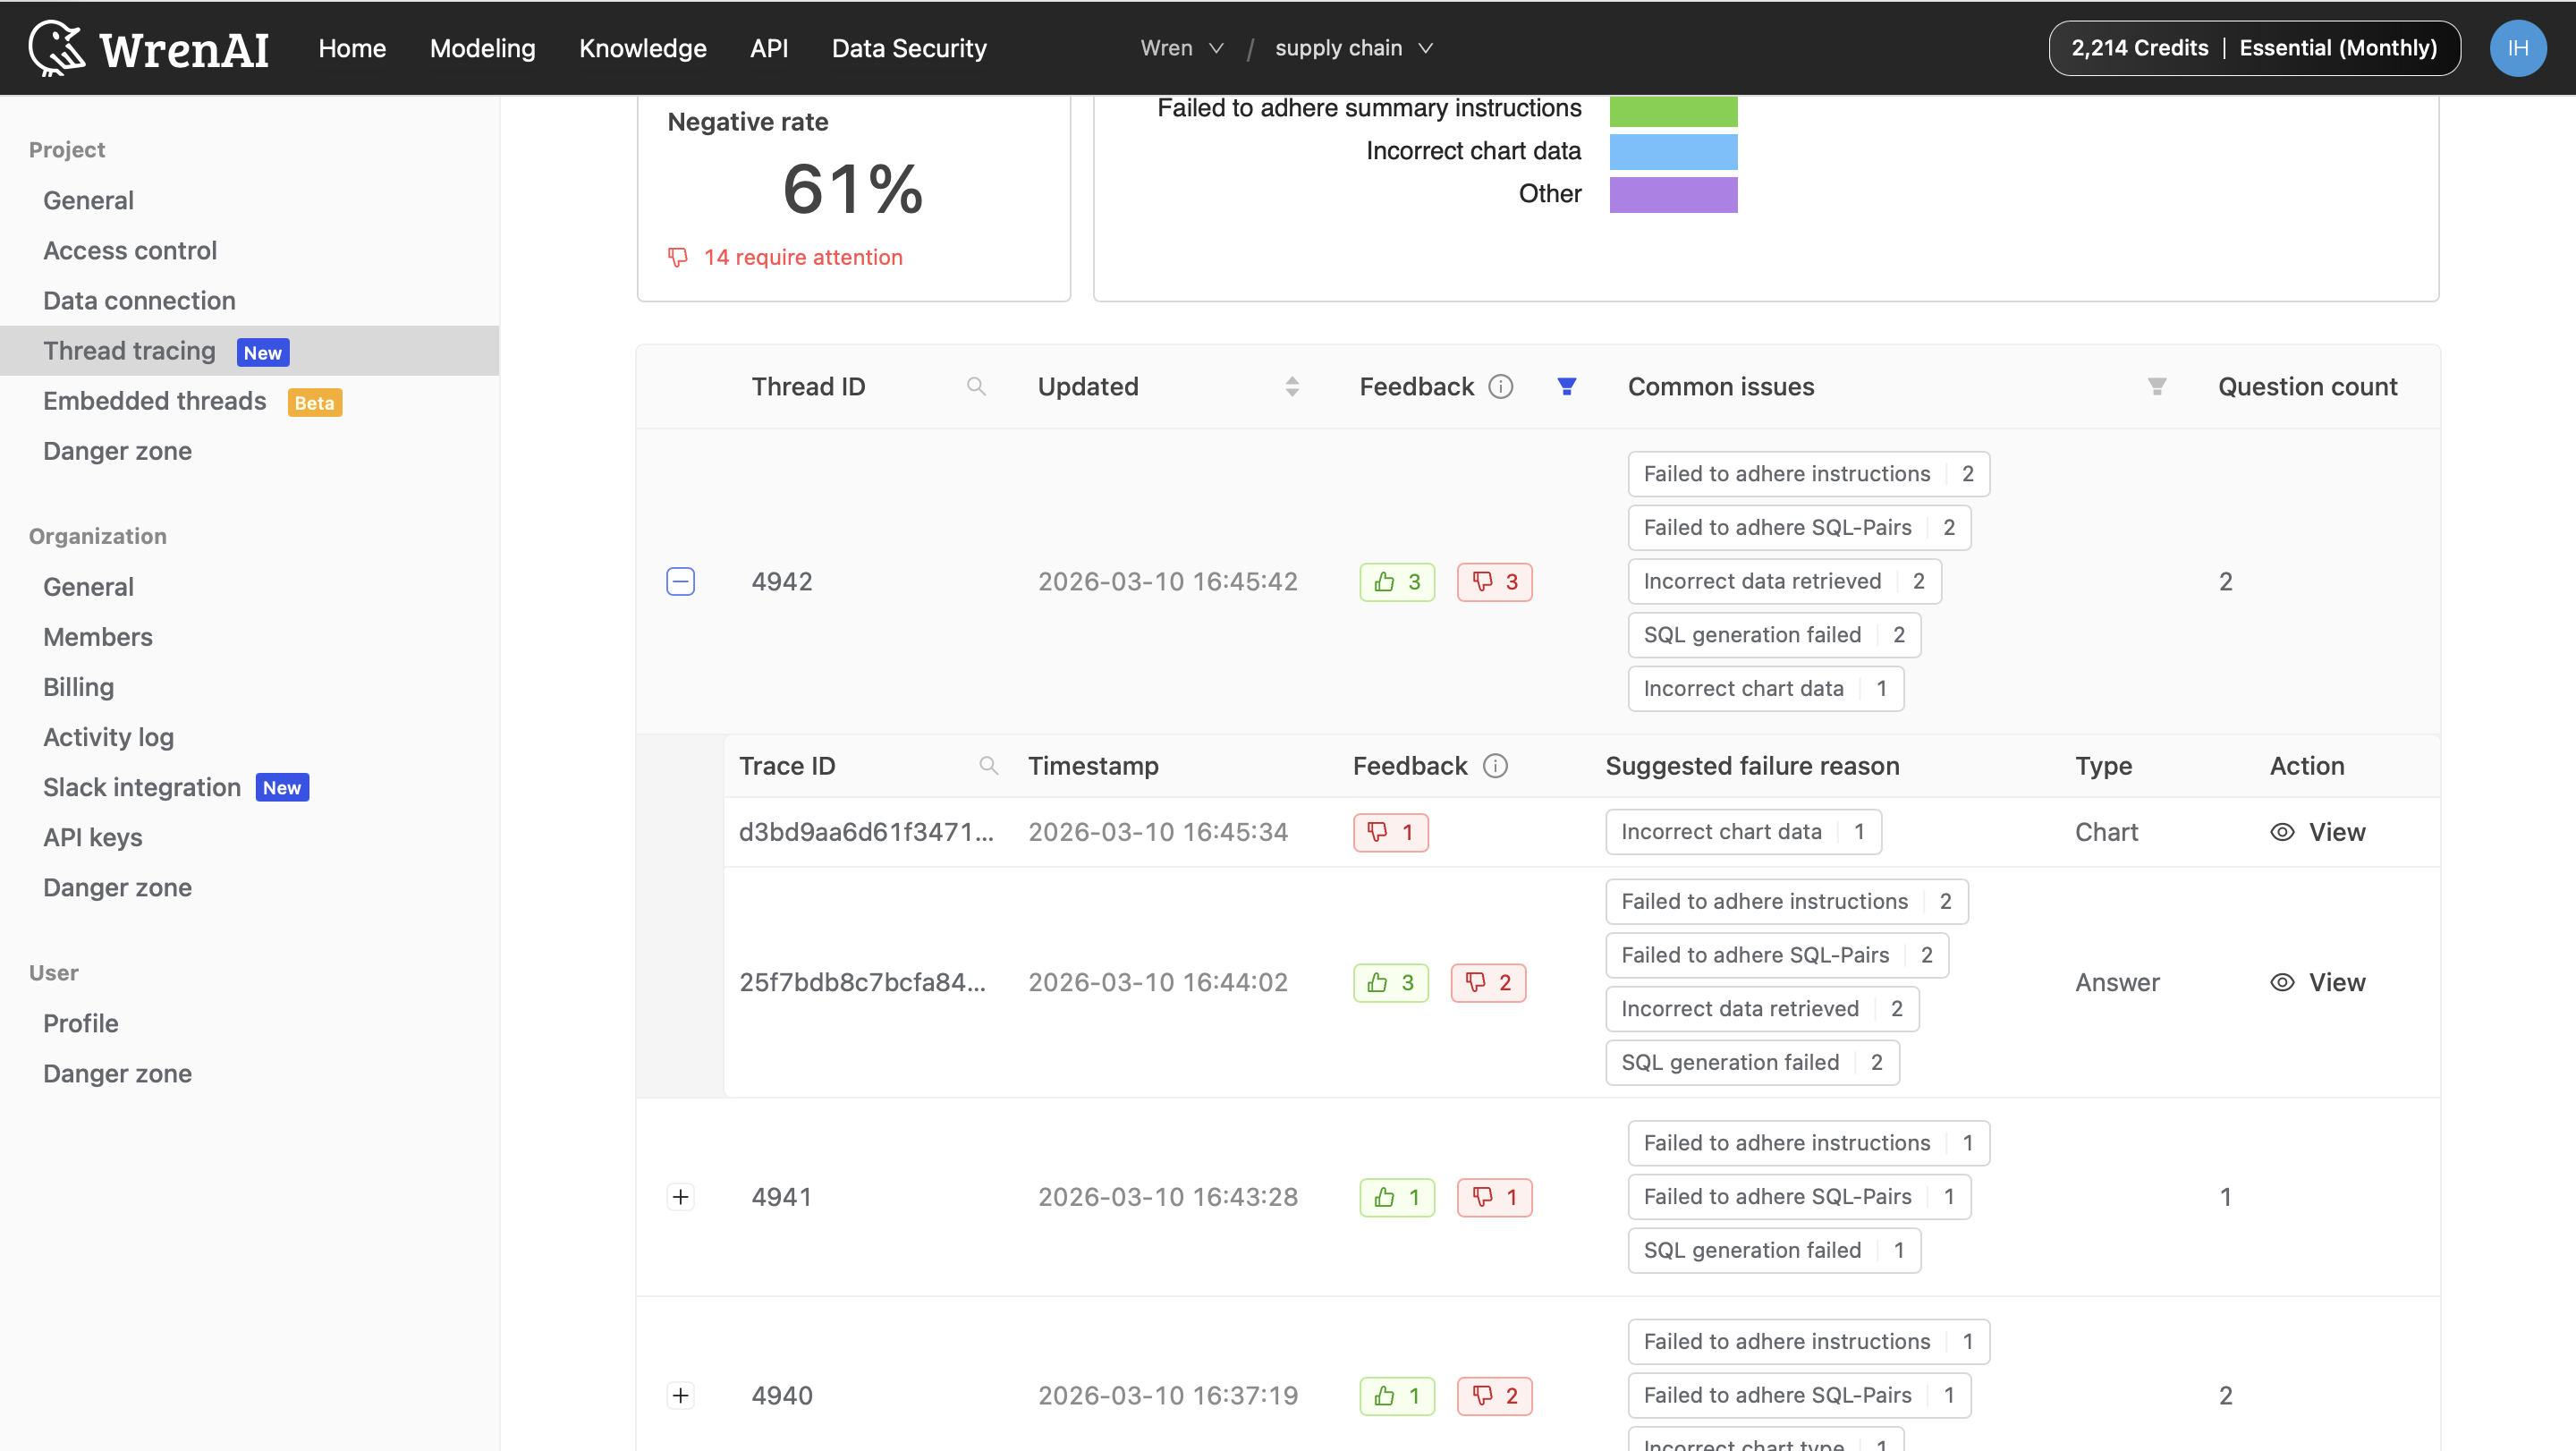
- In the Action column, click View to open the full trace details, including issue report, metadata, and related SQL.
Tips and notes
- Be specific: Selecting the most specific instruction (via dropdown) is usually more actionable than choosing “Other”.
- Data privacy: Feedback is stored securely within the project context and is used to improve accuracy for your project.
- Continuous improvement: The failure breakdown updates in near real-time, so teams can evaluate changes quickly.