Dashboard
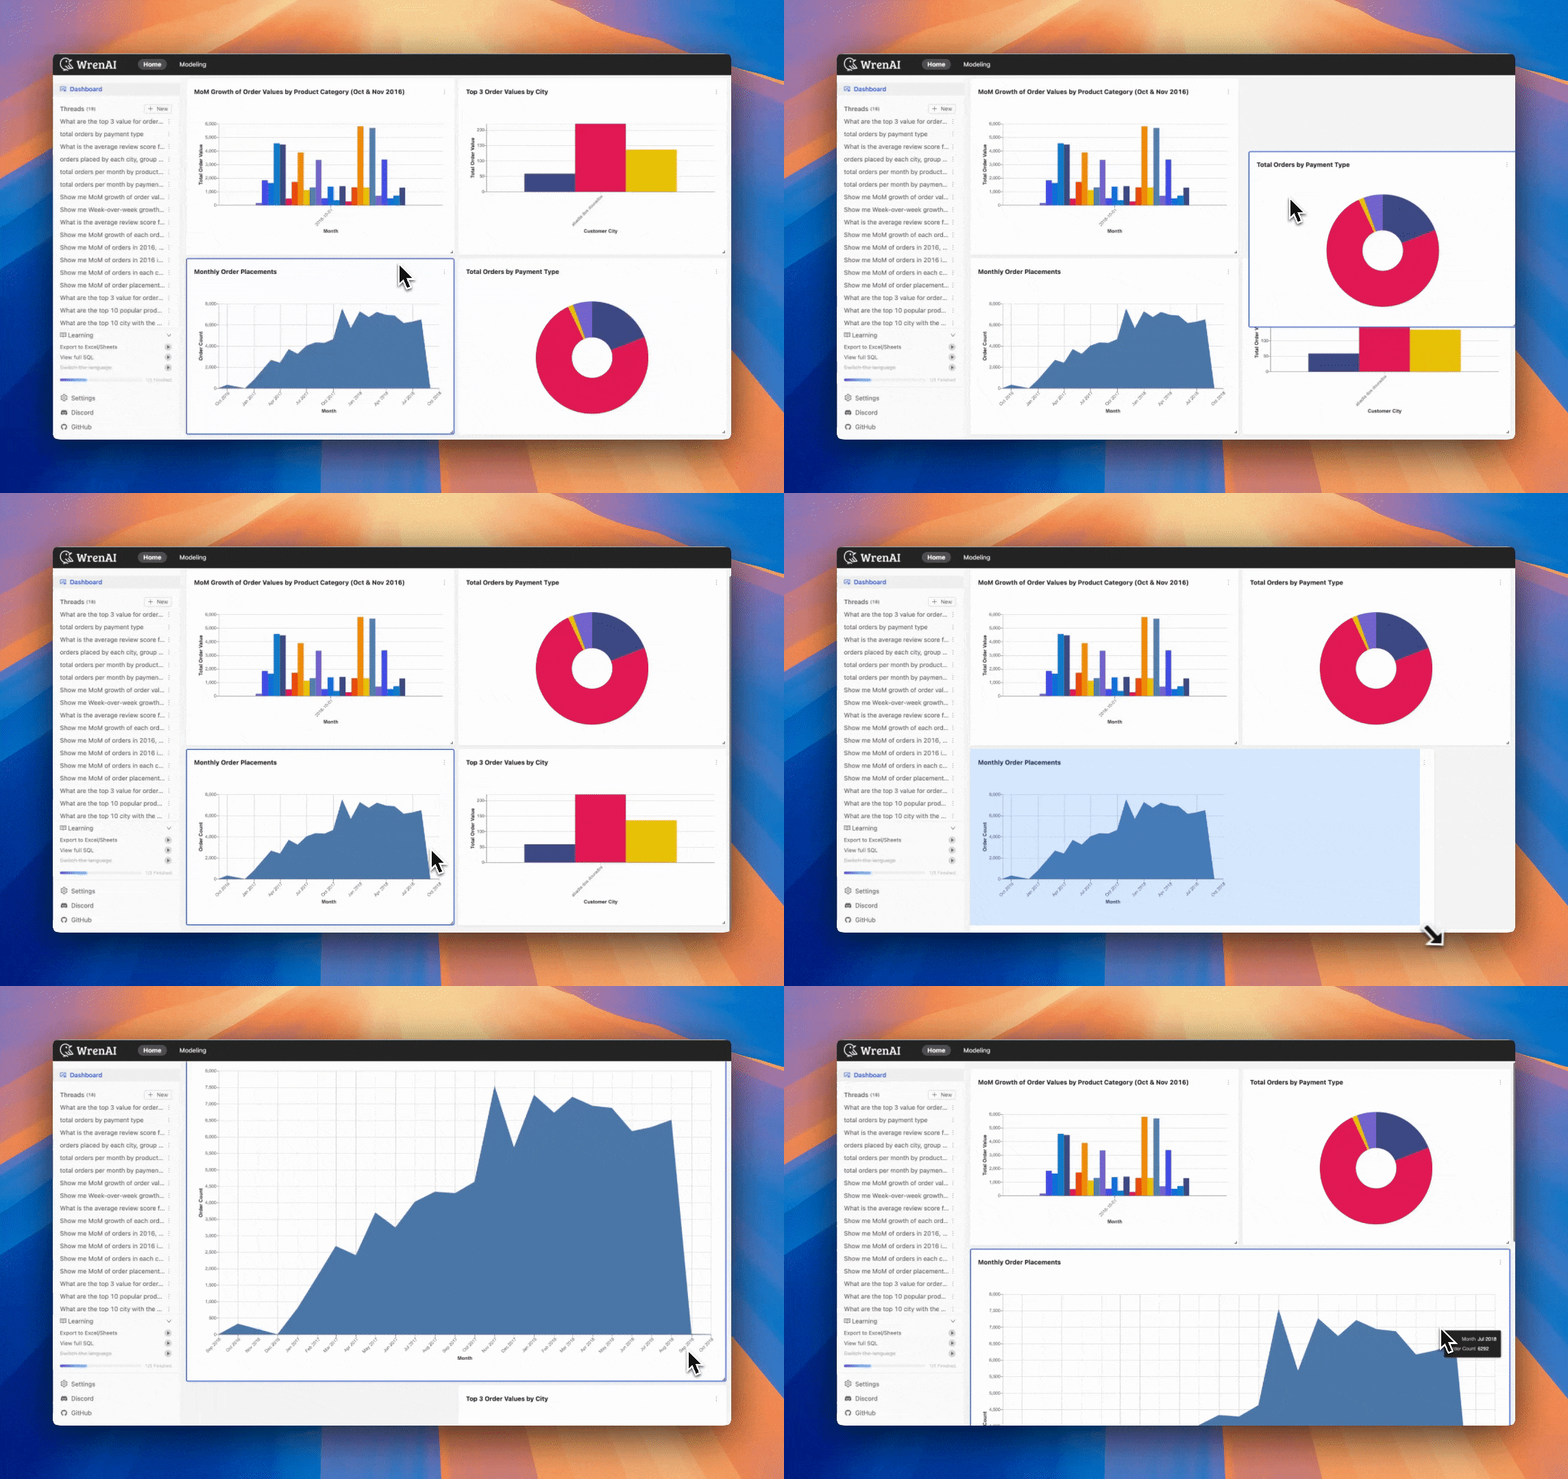
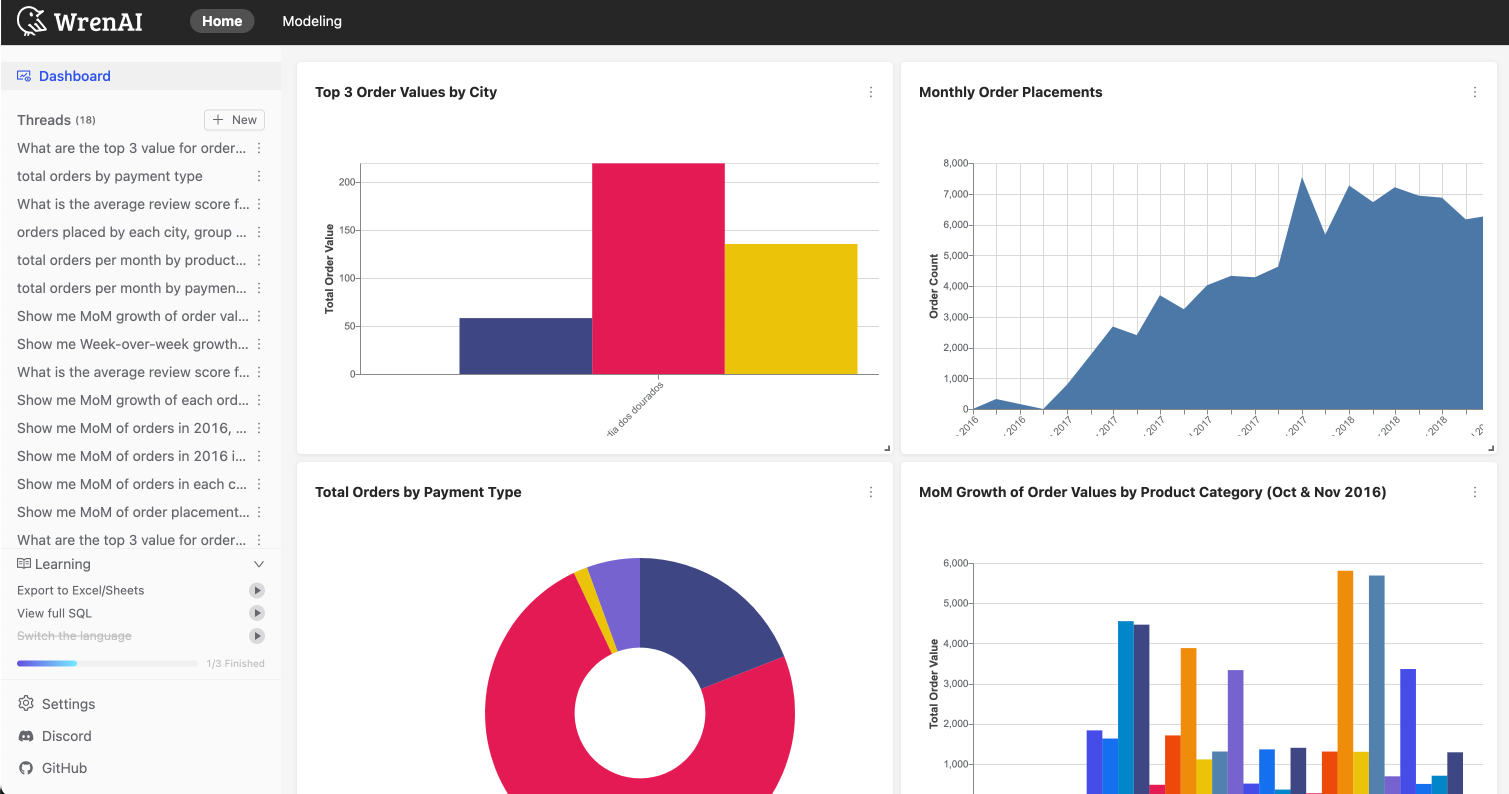
The Dashboard feature allows users to pin generated charts for quick access. This functionality ensures that important visual data insights are always at your fingertips.
Difference between OSS and Paid plans
On Wren AI Paid plans, users can manage multiple dashboards, providing flexibility in organizing and accessing different sets of data.
Learn more about the Dashboard feature on Wren AI Paid plans.
How to Use the Dashboard
- Generate a Chart: Begin by generating a chart in your threads.
- Pin the Chart: After generating the chart, you will find a
pinicon on top of the chart. Click on it to pin the chart to your dashboard.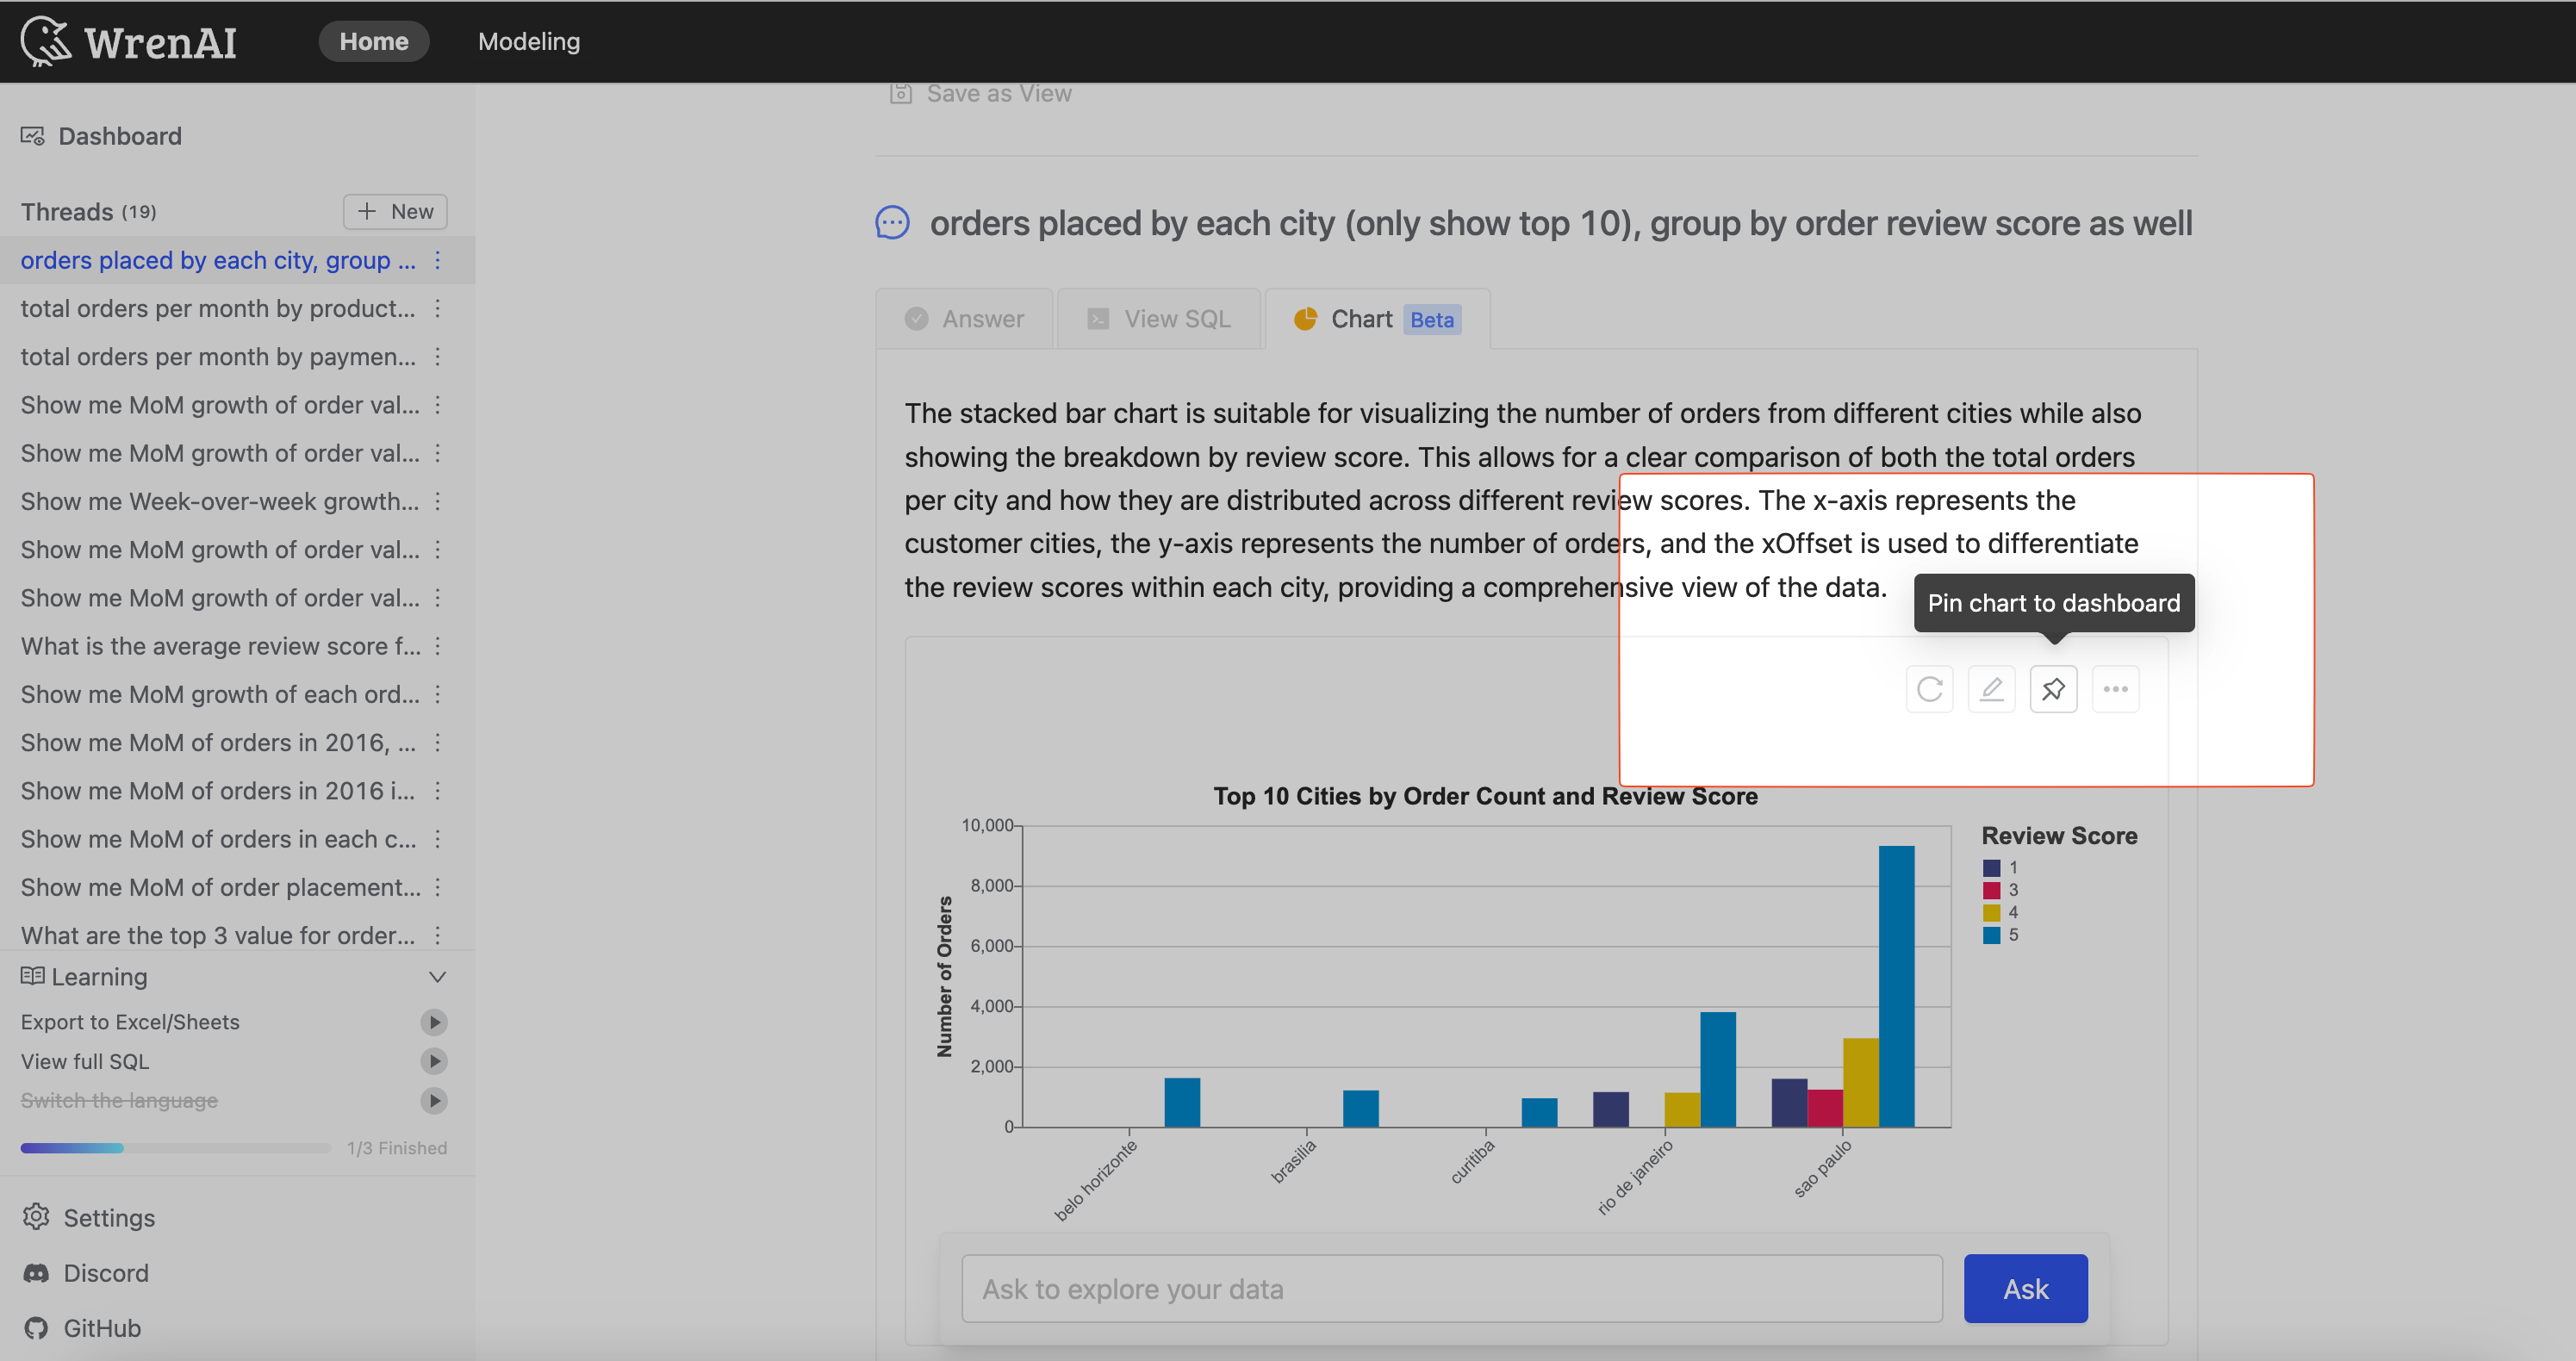
- Access Pinned Charts: Pinned charts will be displayed on your dashboard. Navigate to the
dashboardto view your pinned charts.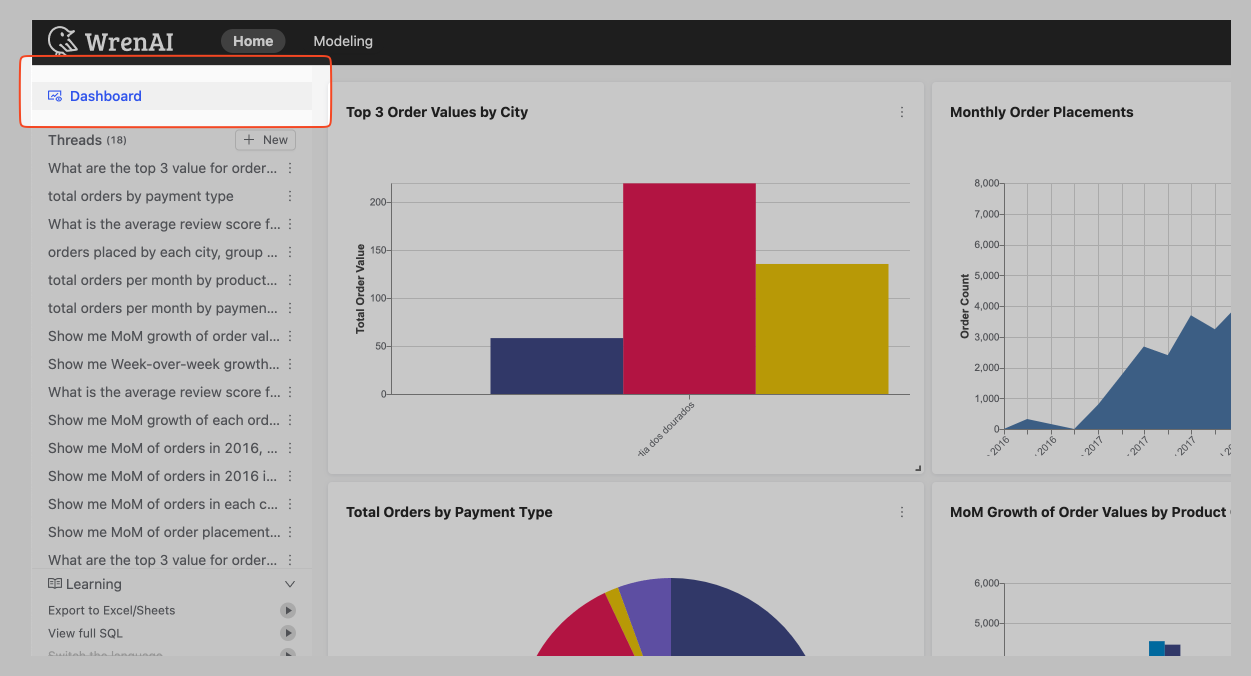
Managing Your Dashboard
- Unpin a Chart: To remove a chart from your dashboard, go to the pinned chart and click the 'delete' option.
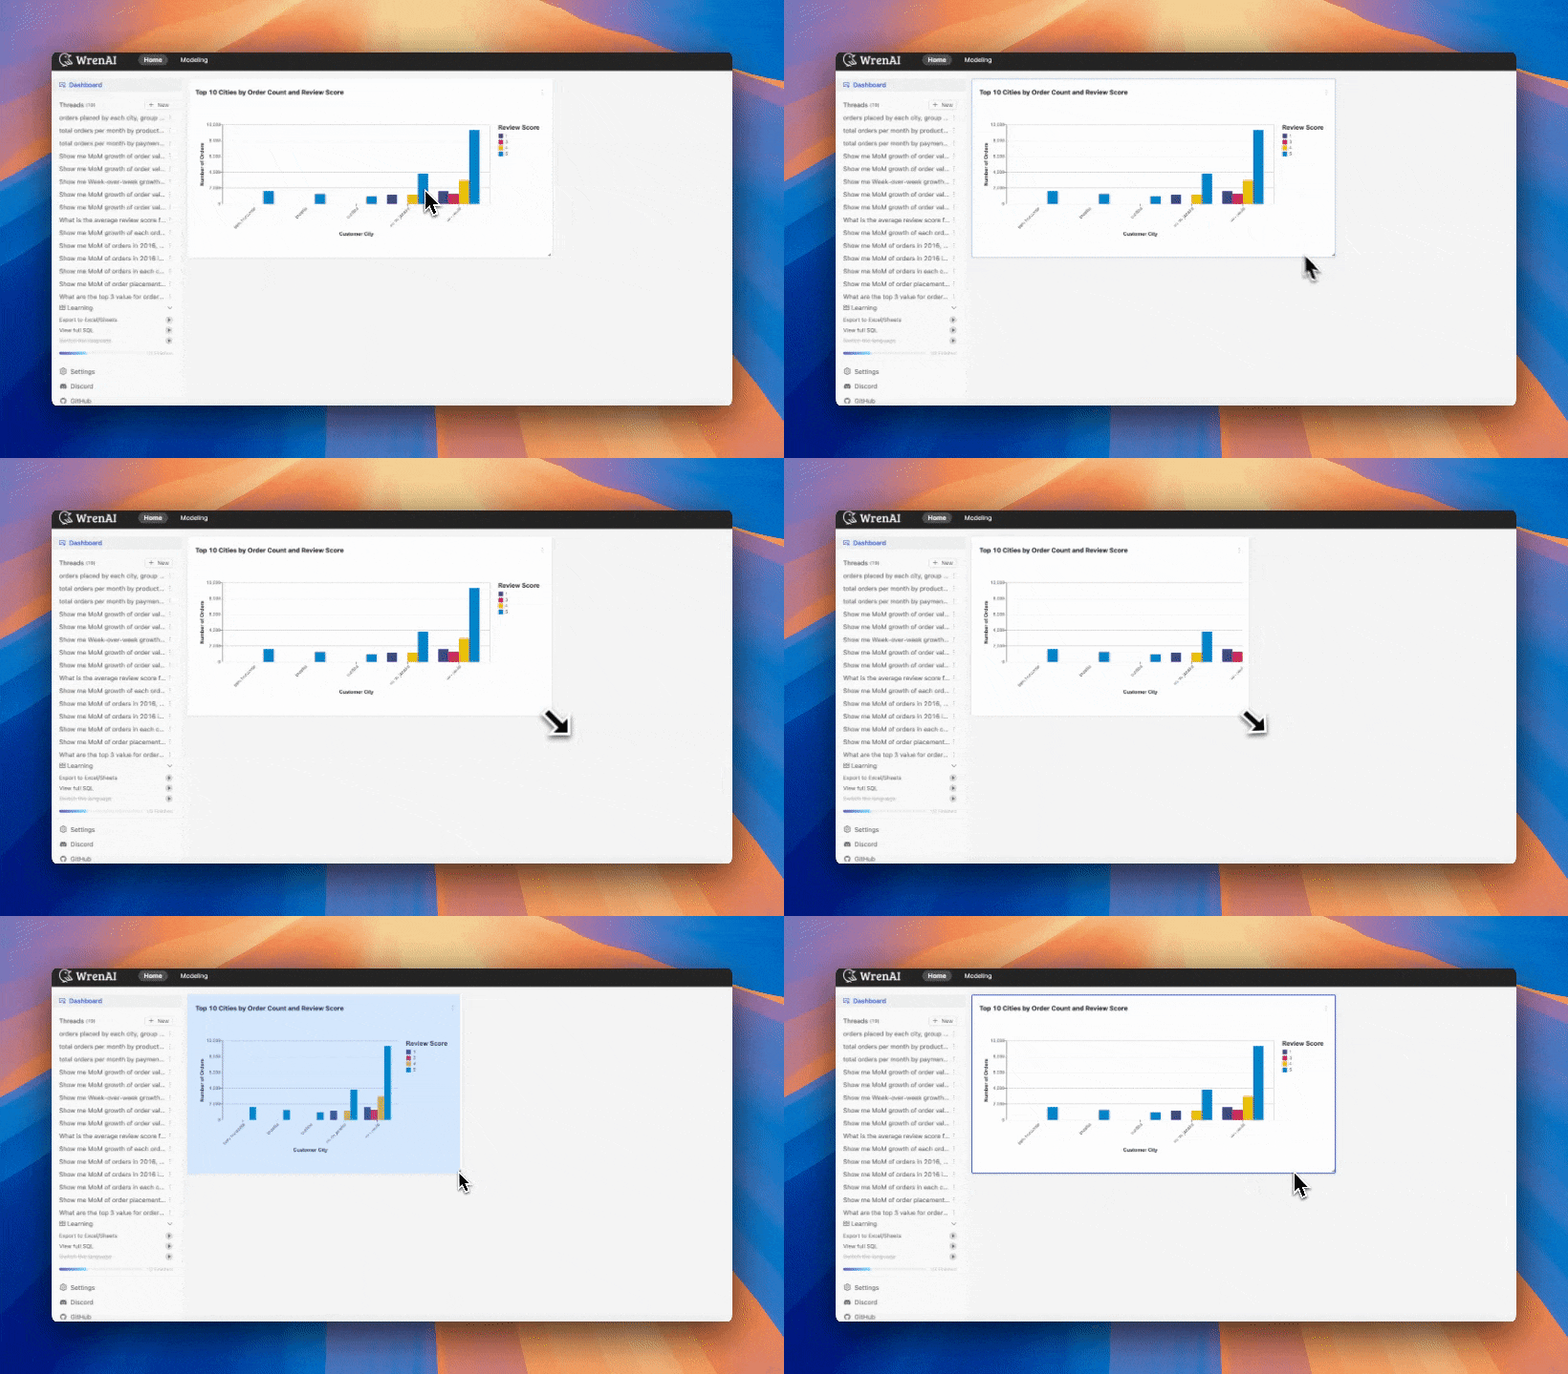
- Resize a Chart: You can resize a chart by clicking and dragging the right-bottom corner of the chart.
- Reorder Pinned Charts: You can rearrange your pinned charts by dragging and dropping them within the 'Pinned Charts' section on your dashboard.
