Generate Chart
Wren AI automatically generates insightful charts to help visualize your data and uncover meaningful patterns.
Automatic Chart Generation
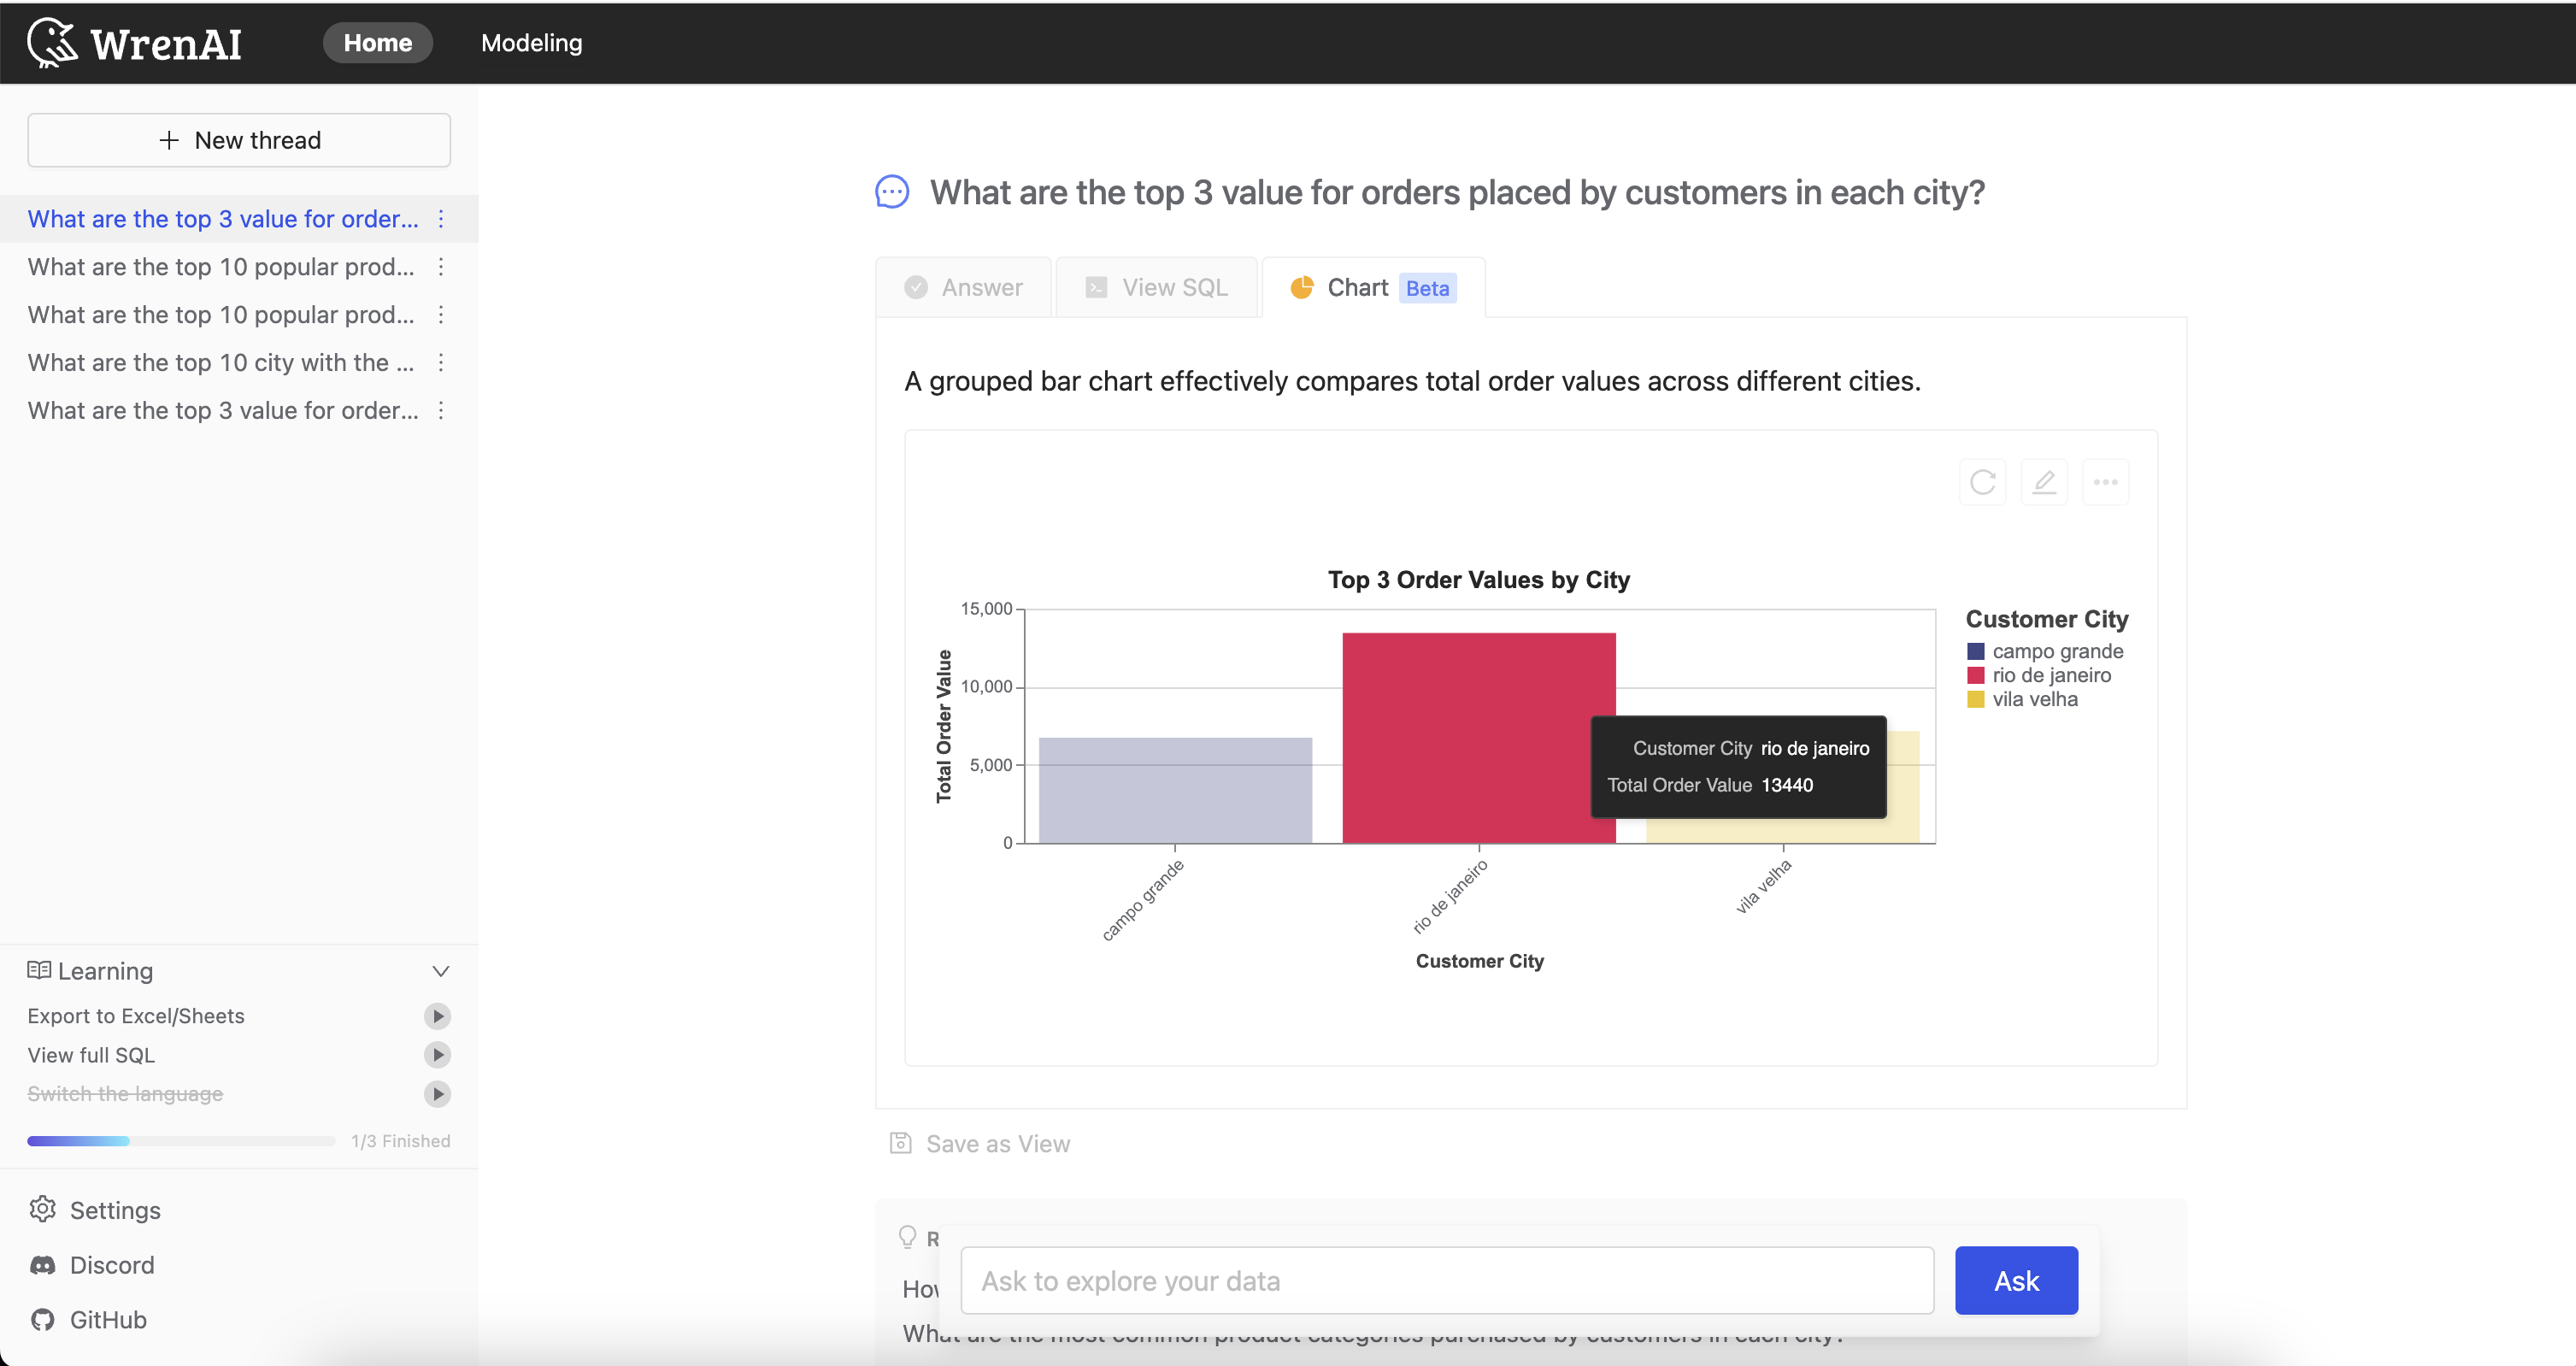
When you ask a question, Wren AI analyzes your data and automatically generates the most appropriate chart type to visualize the results. Simply click the "Chart" tab to see the chart.
Supported Chart Types
Bar Chart
Useful for comparing quantities of different categories.
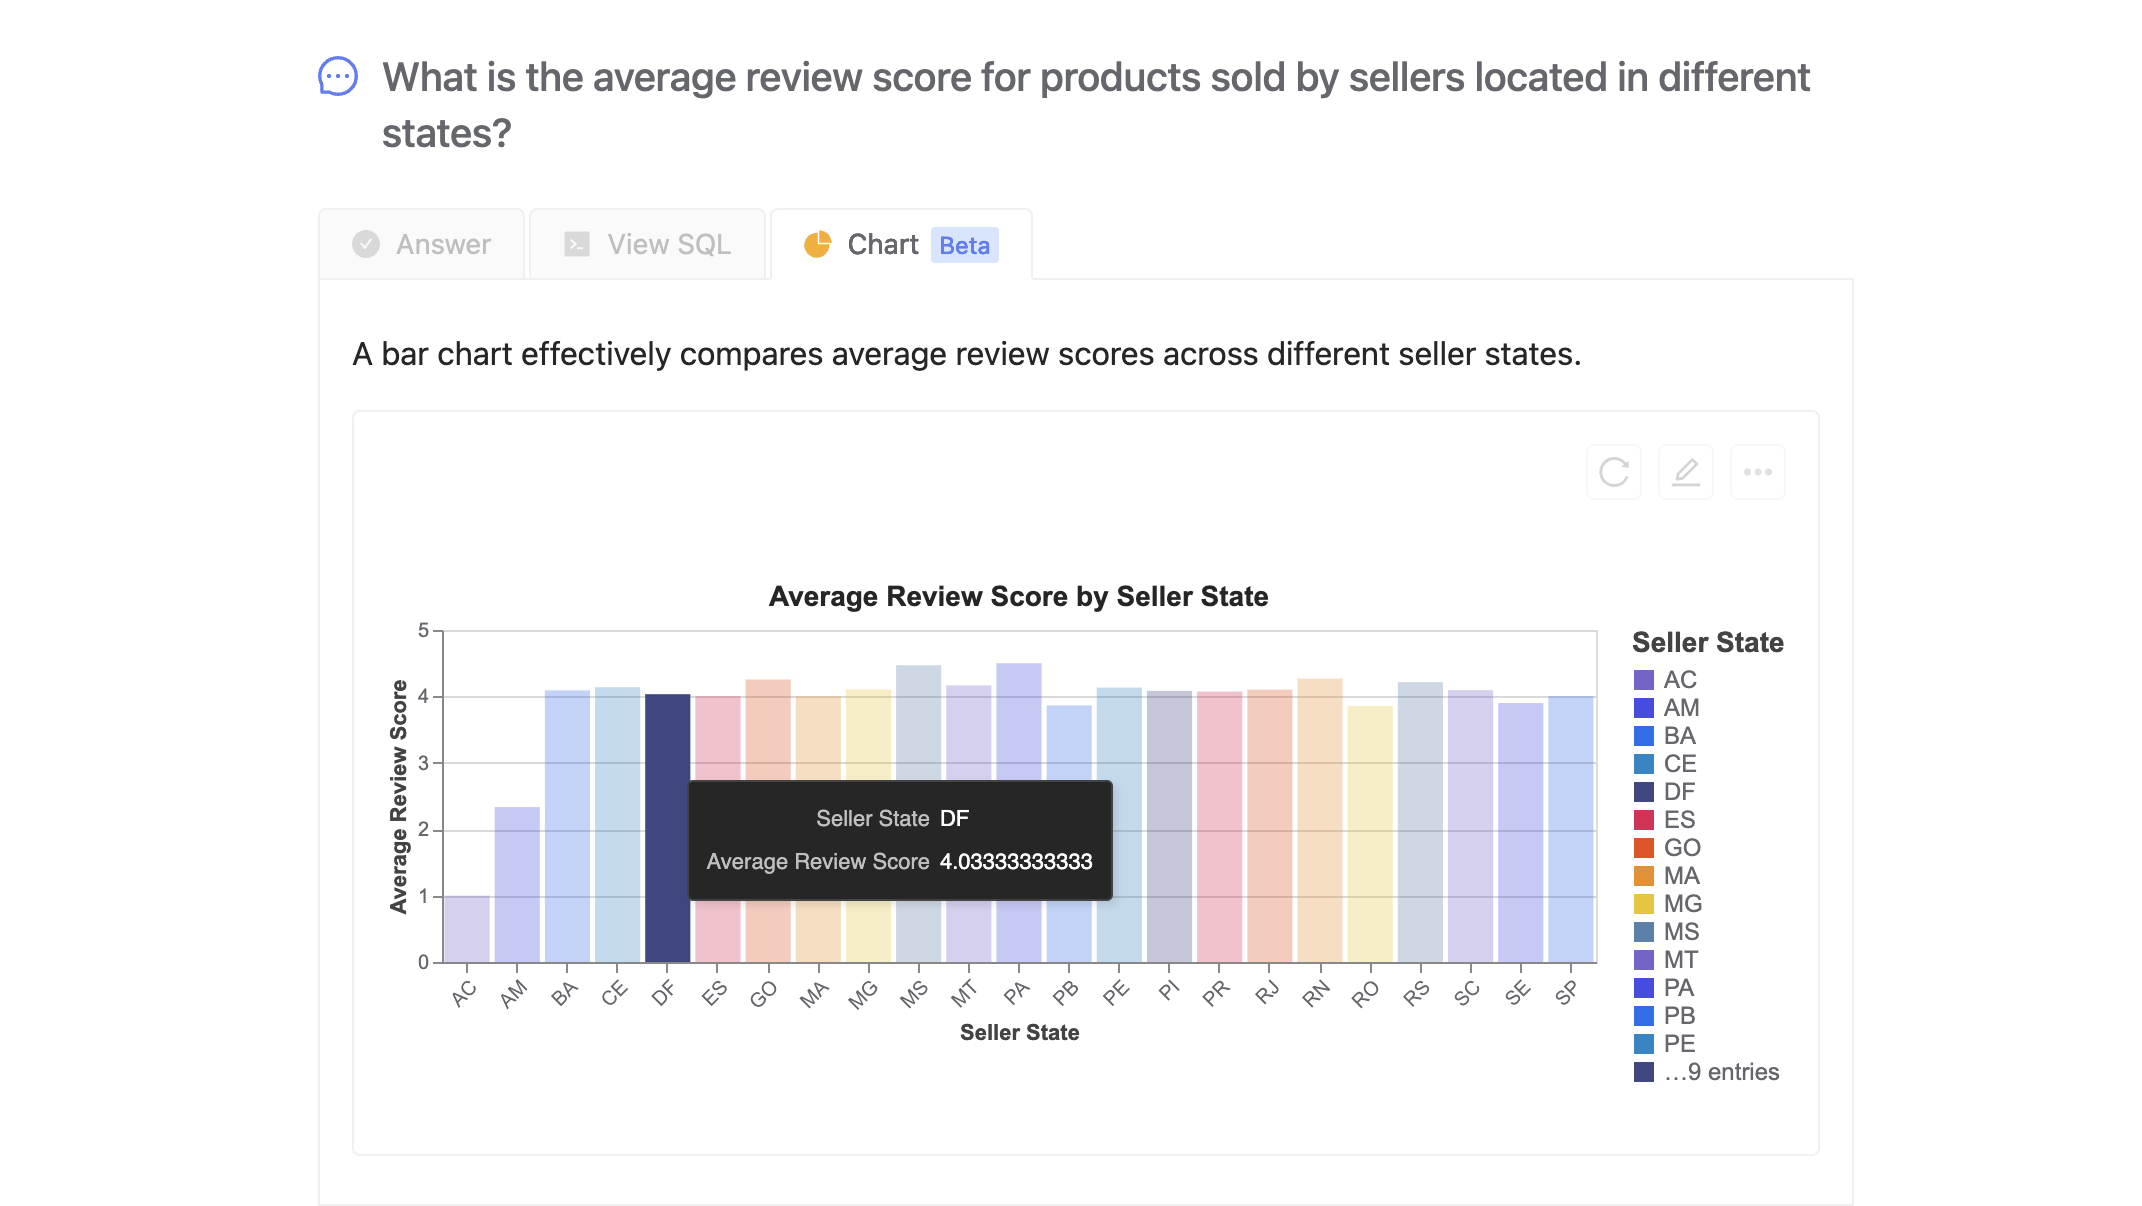
Group Bar Chart
Ideal for comparing sub-categories within a main category.
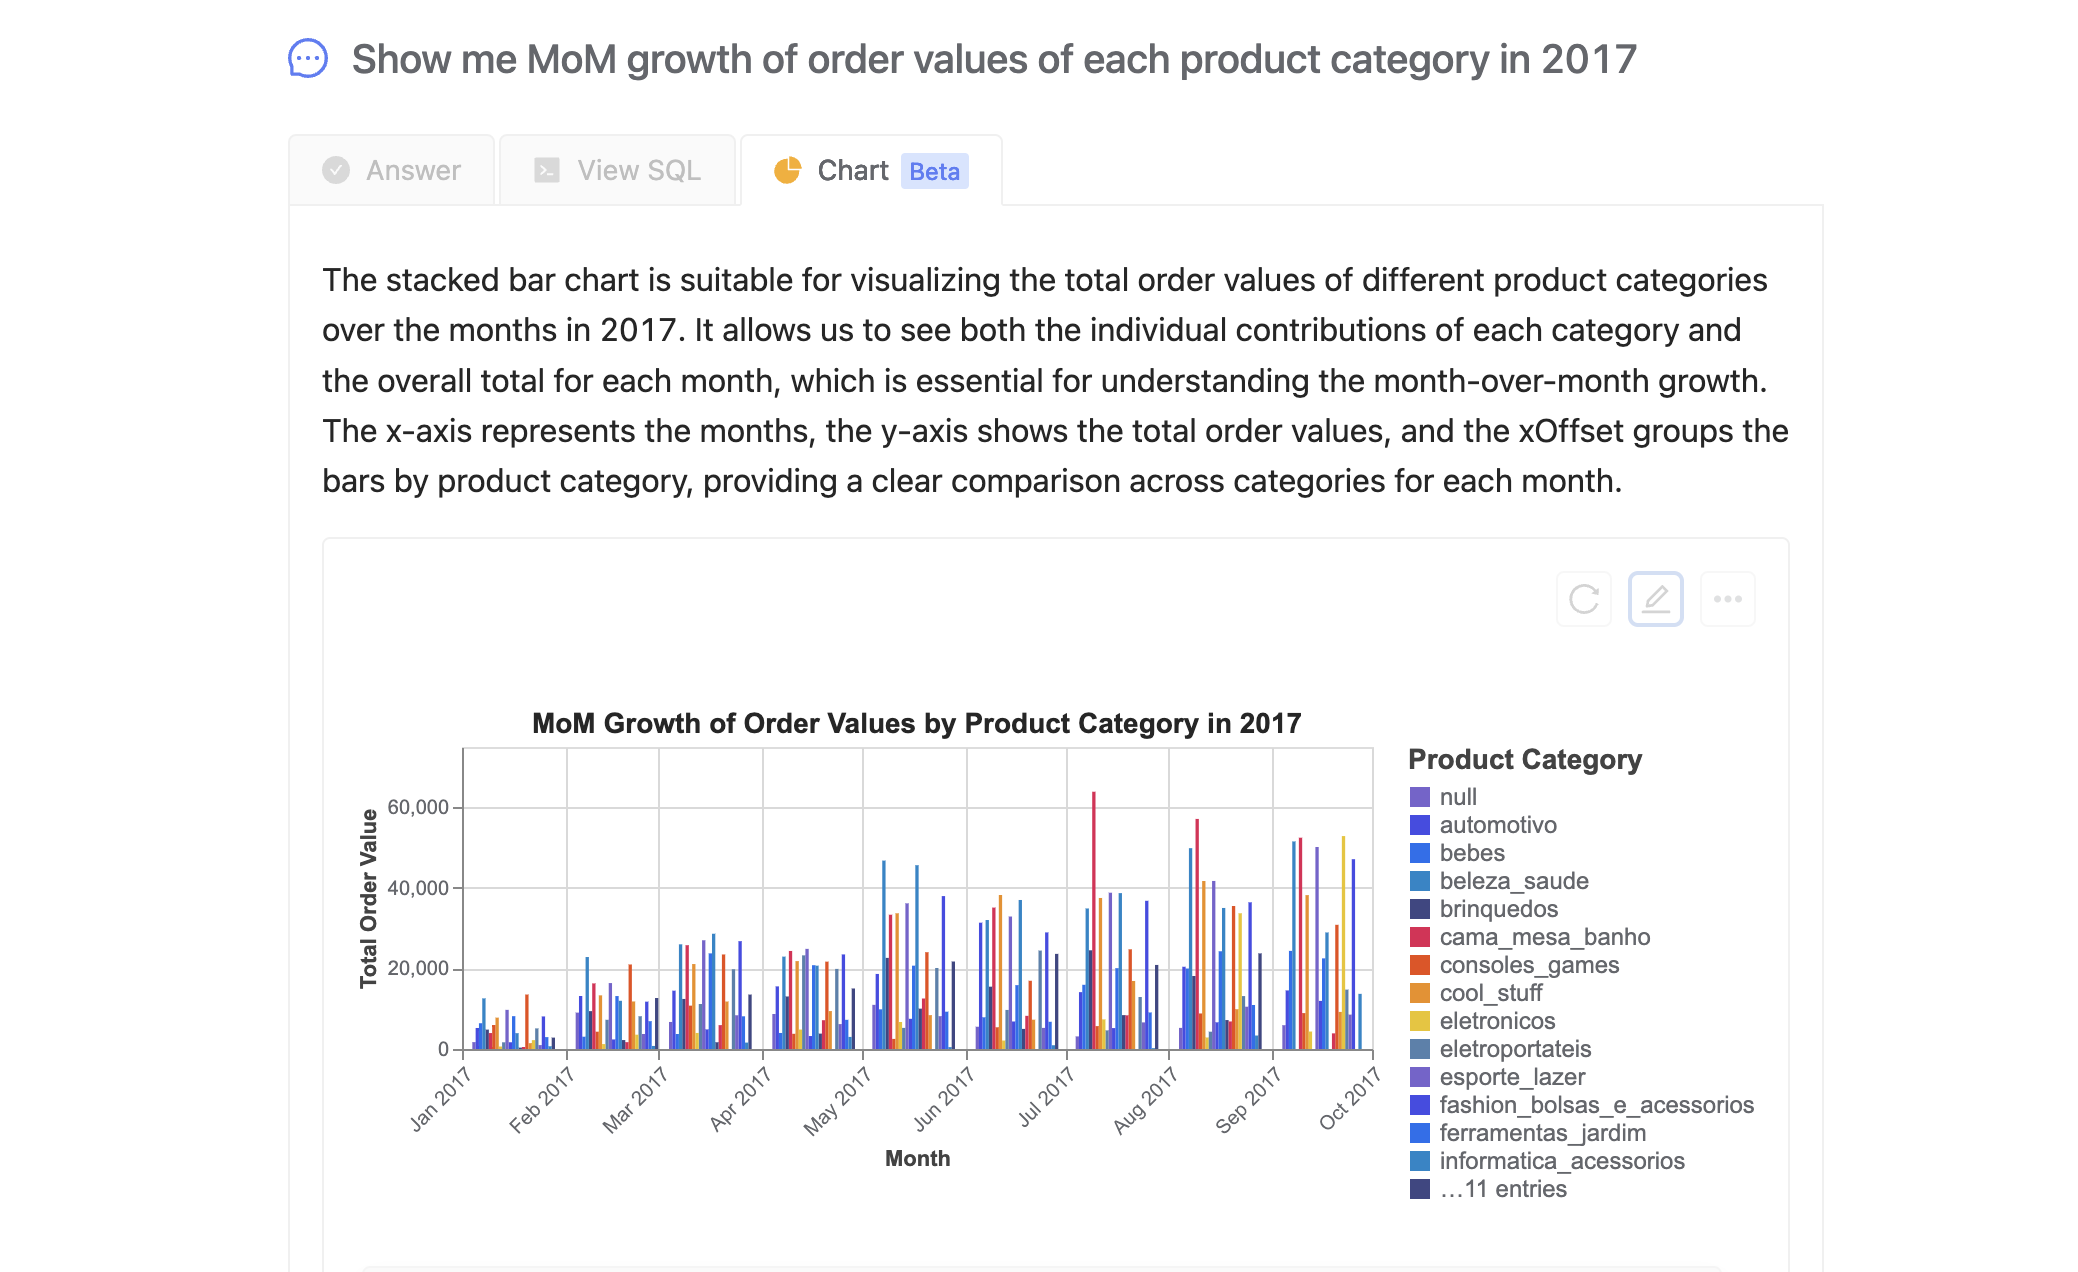
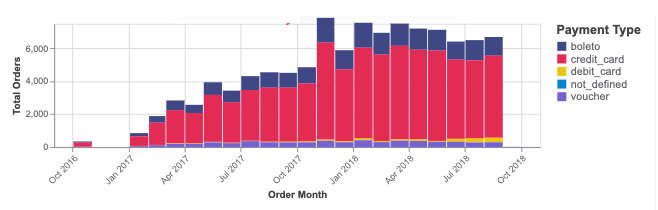
Stacked Bar Chart
Great for showing the composition of categories.
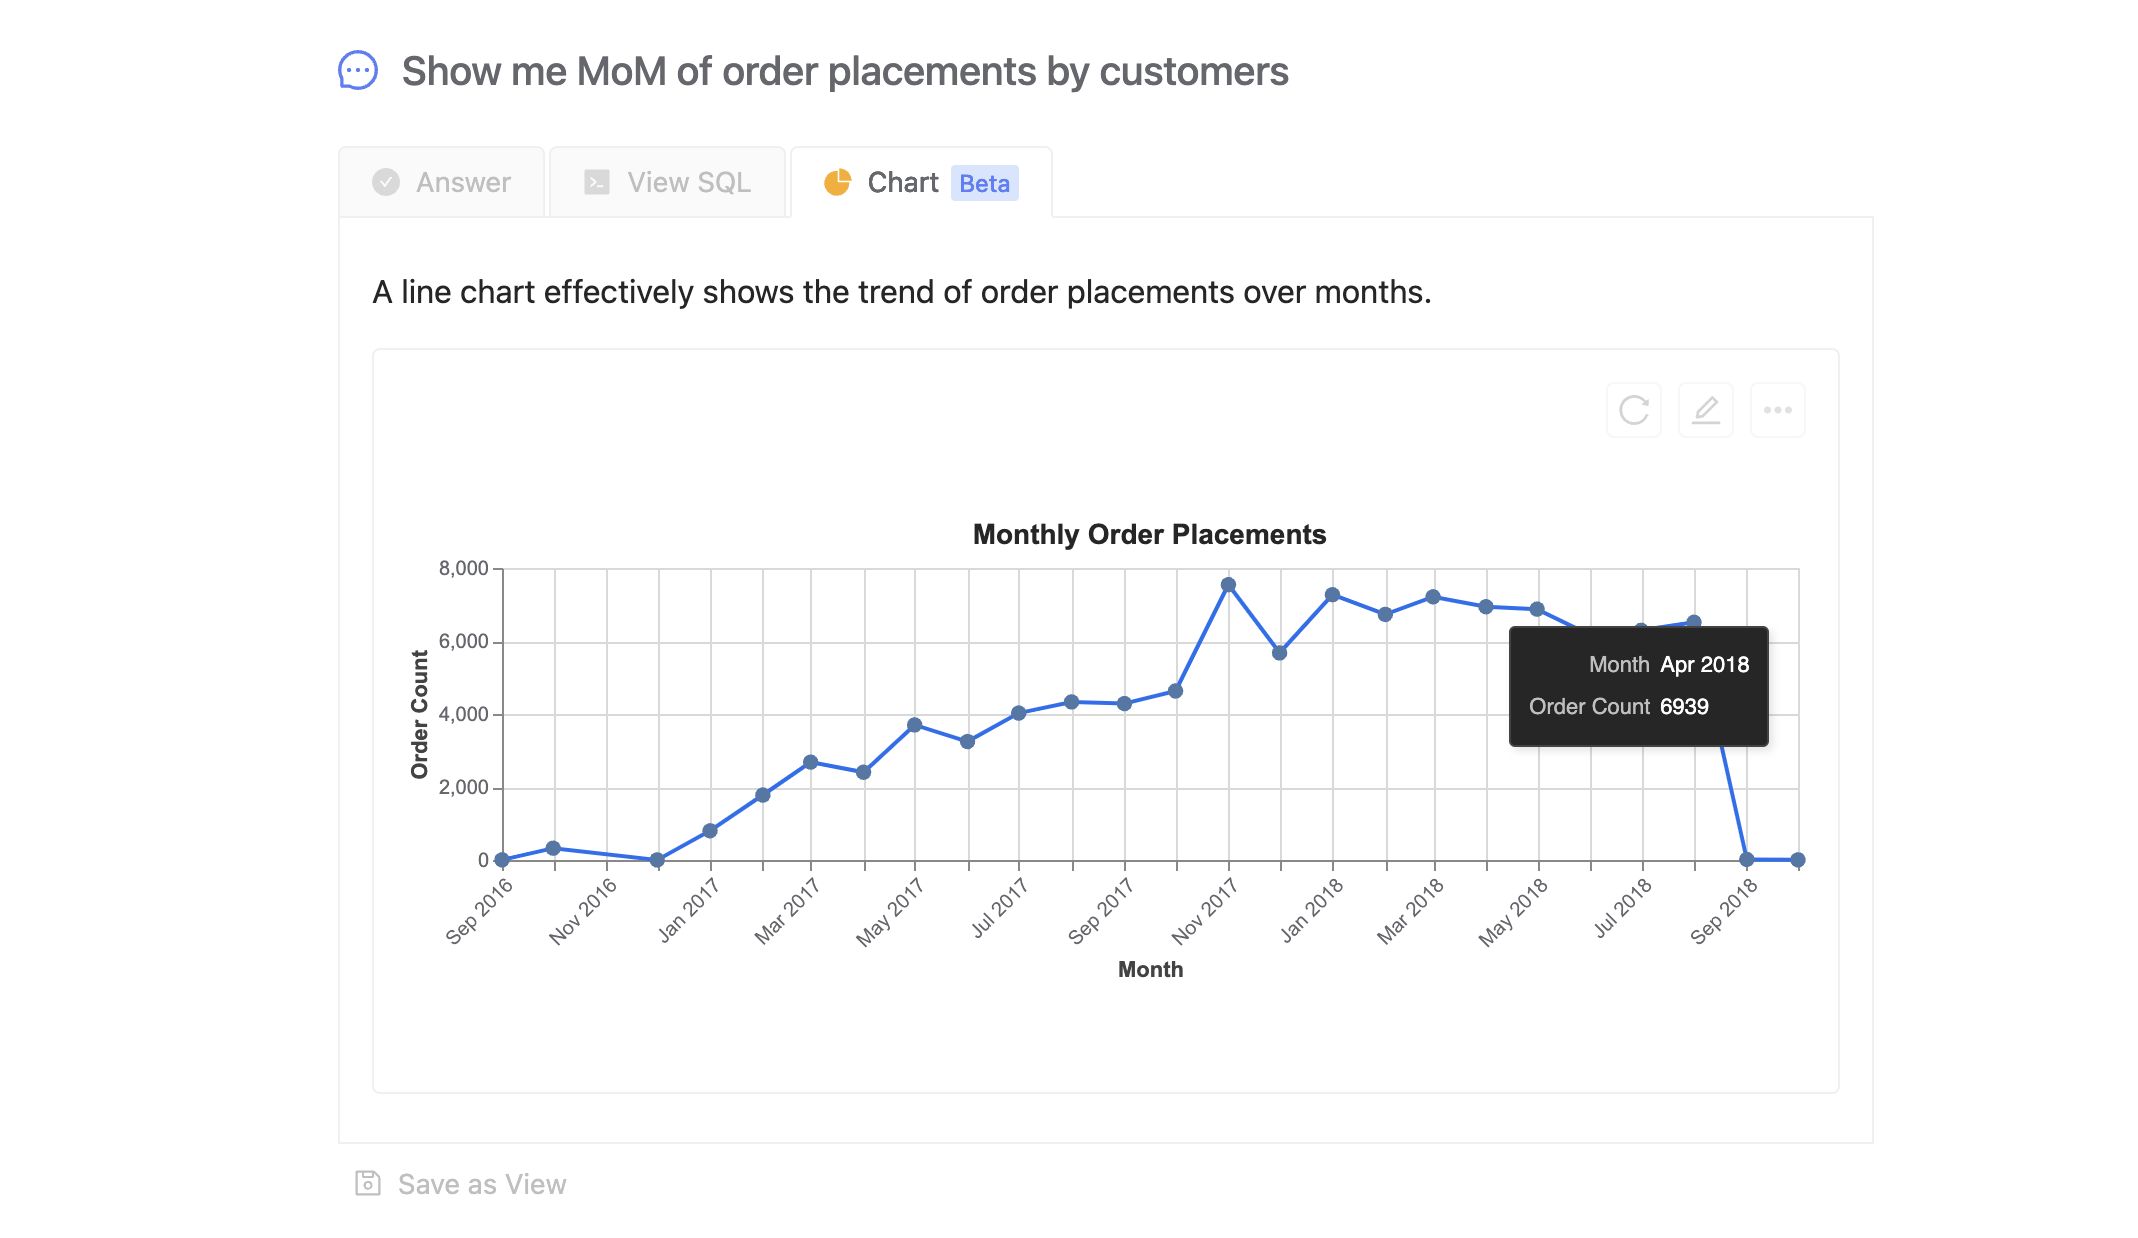
Line Chart
Perfect for visualizing trends over time.
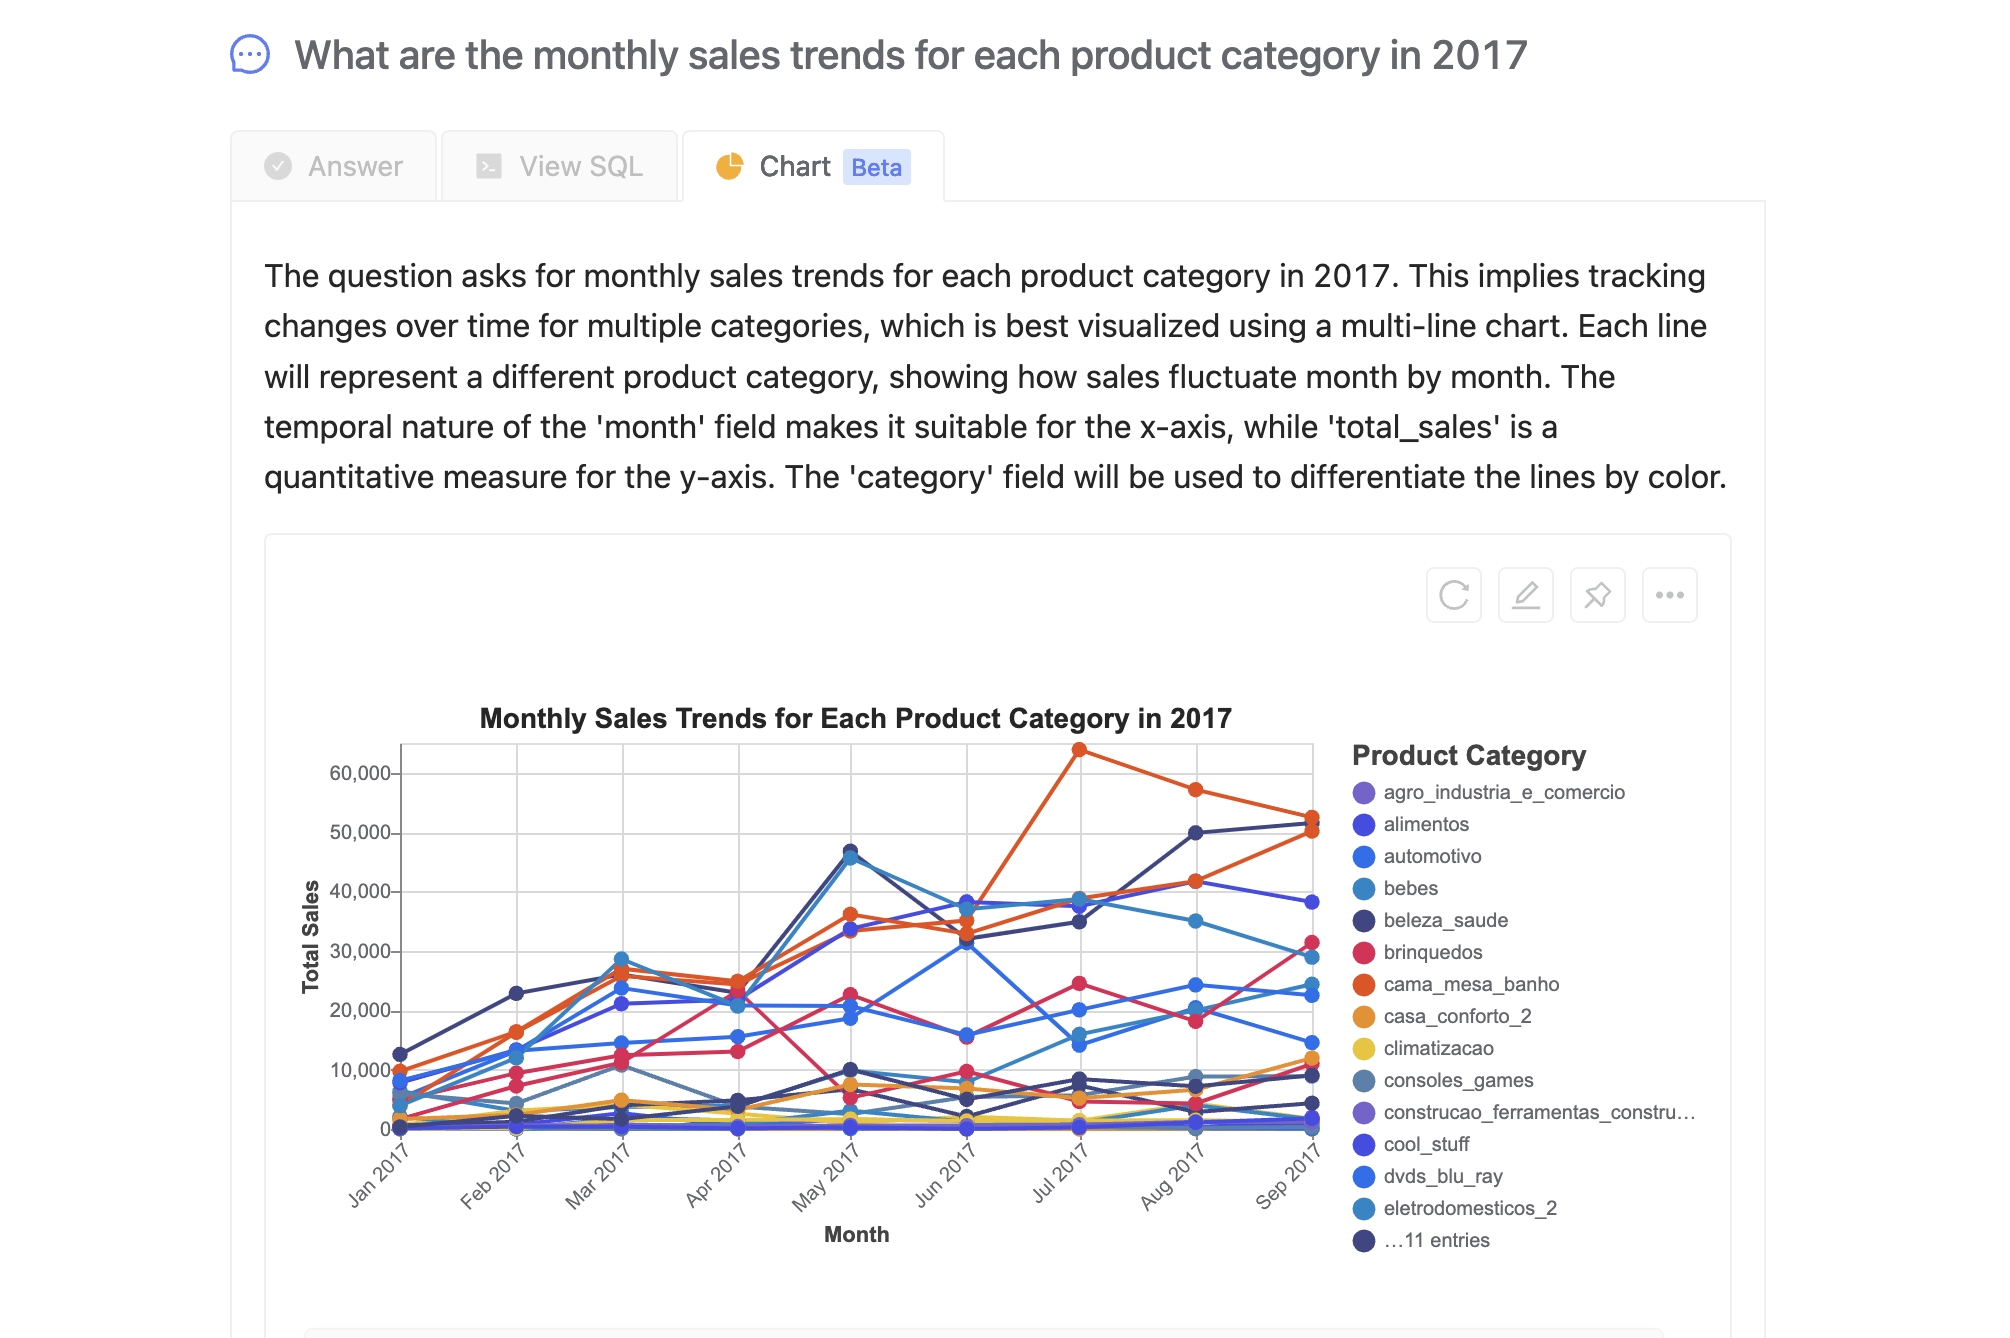
Multi-Line Chart
Ideal for comparing multiple trends over time.
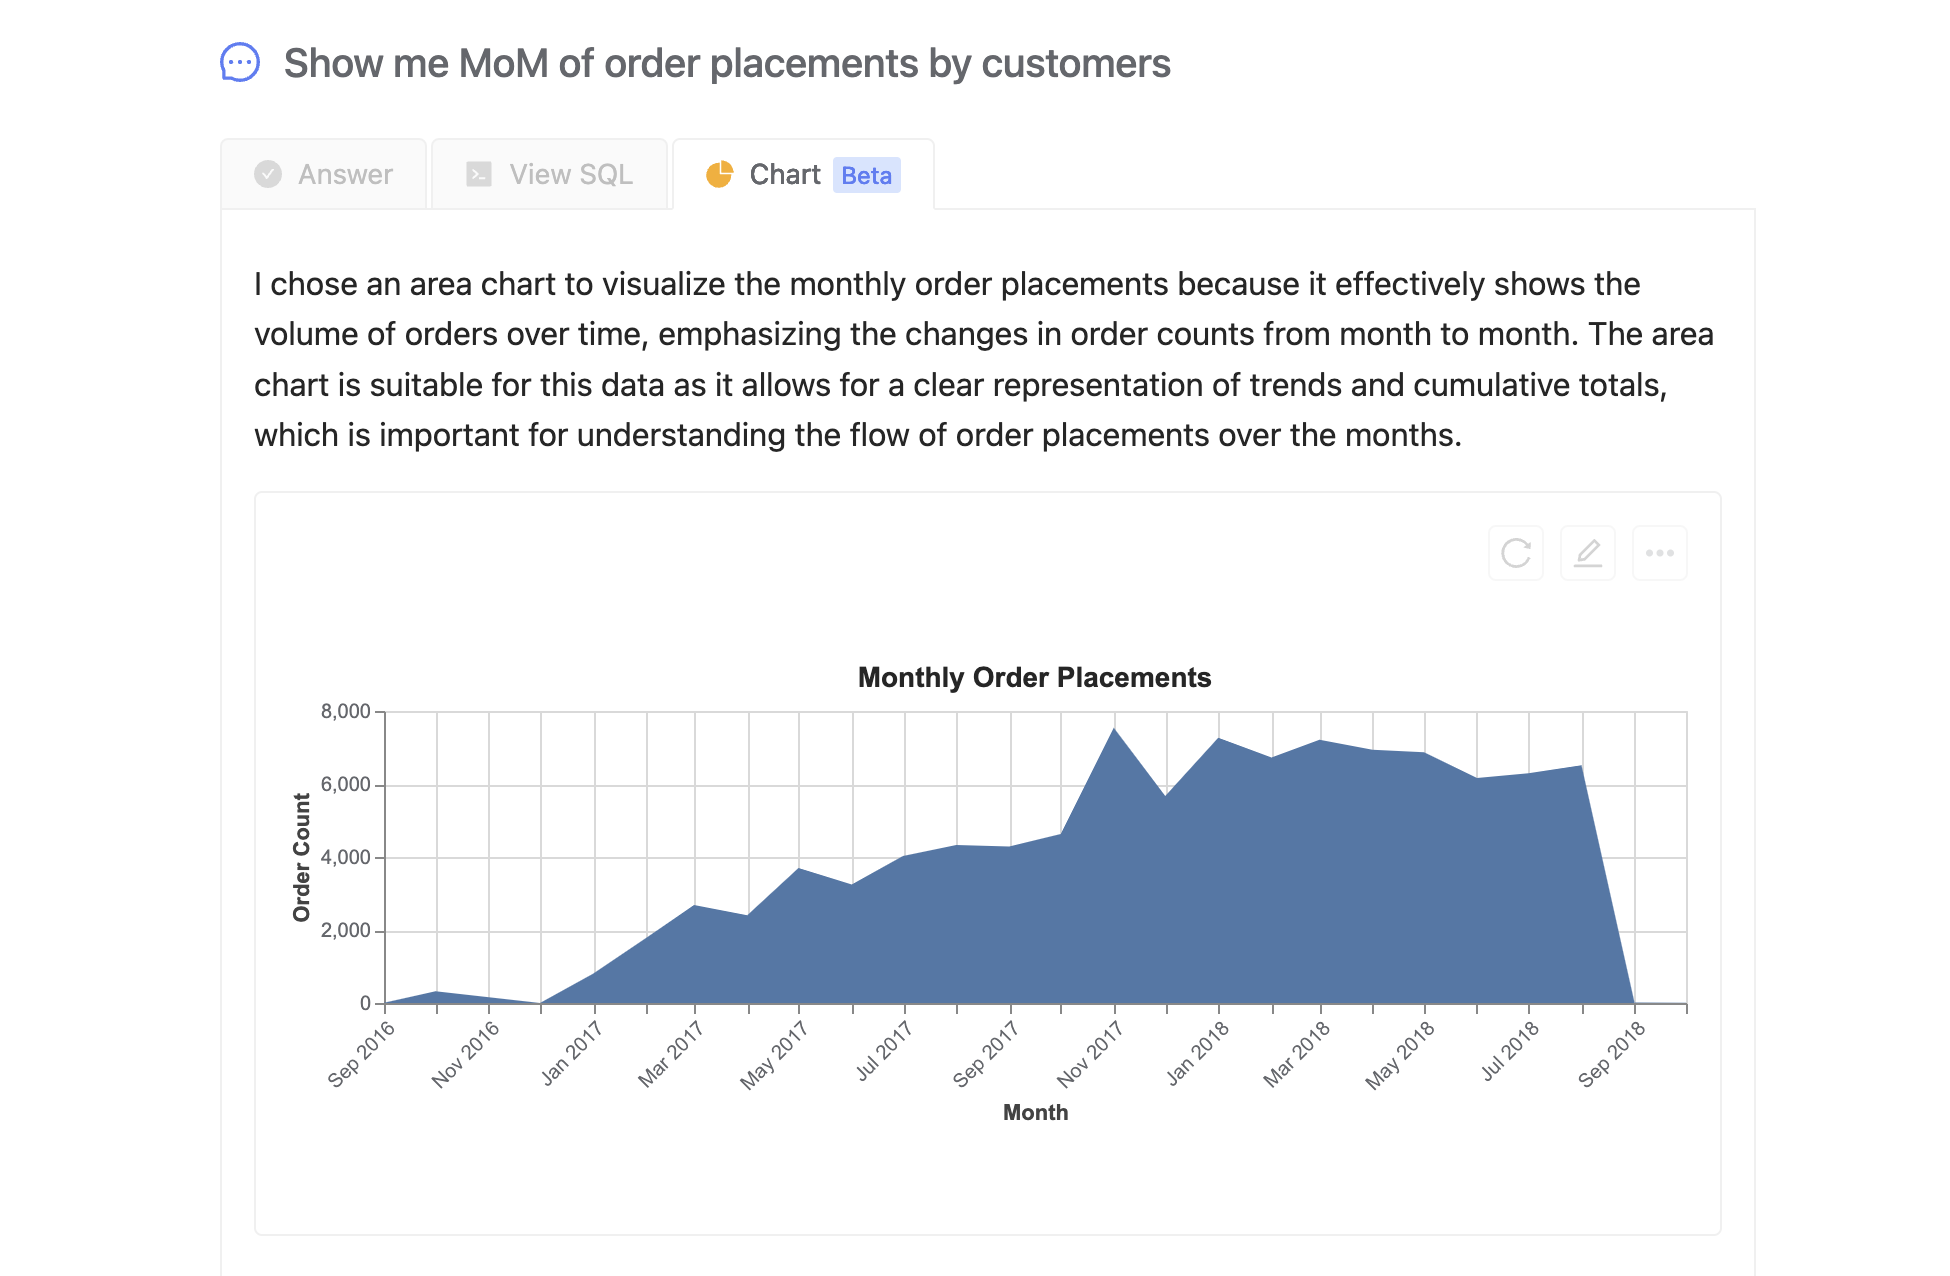
Area Chart
Similar to line charts but with filled areas to emphasize volume.
Pie Chart
Useful for showing proportions.
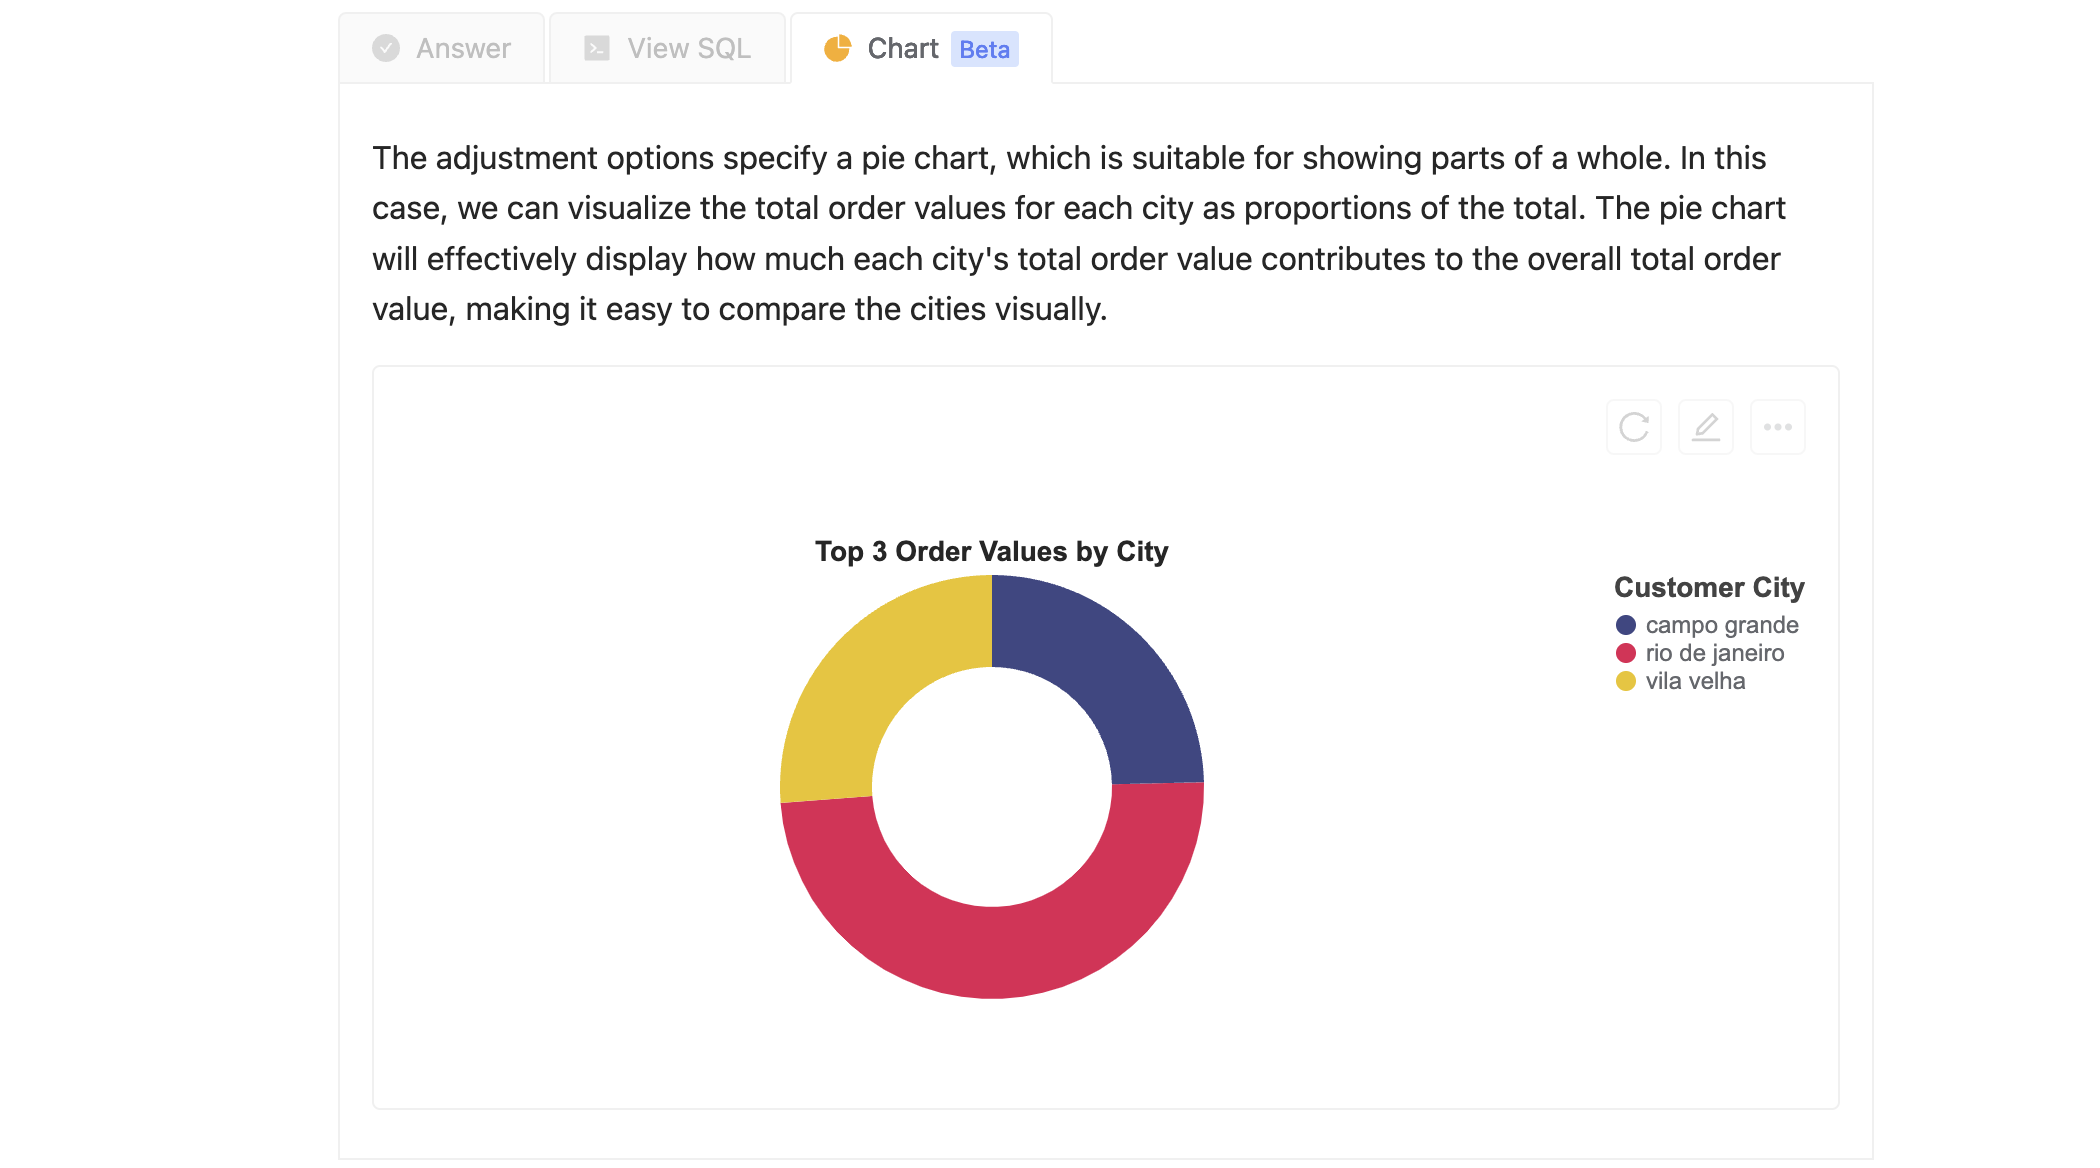
Adjusting the Chart
You can adjust the chart by clicking the "Edit" icon.
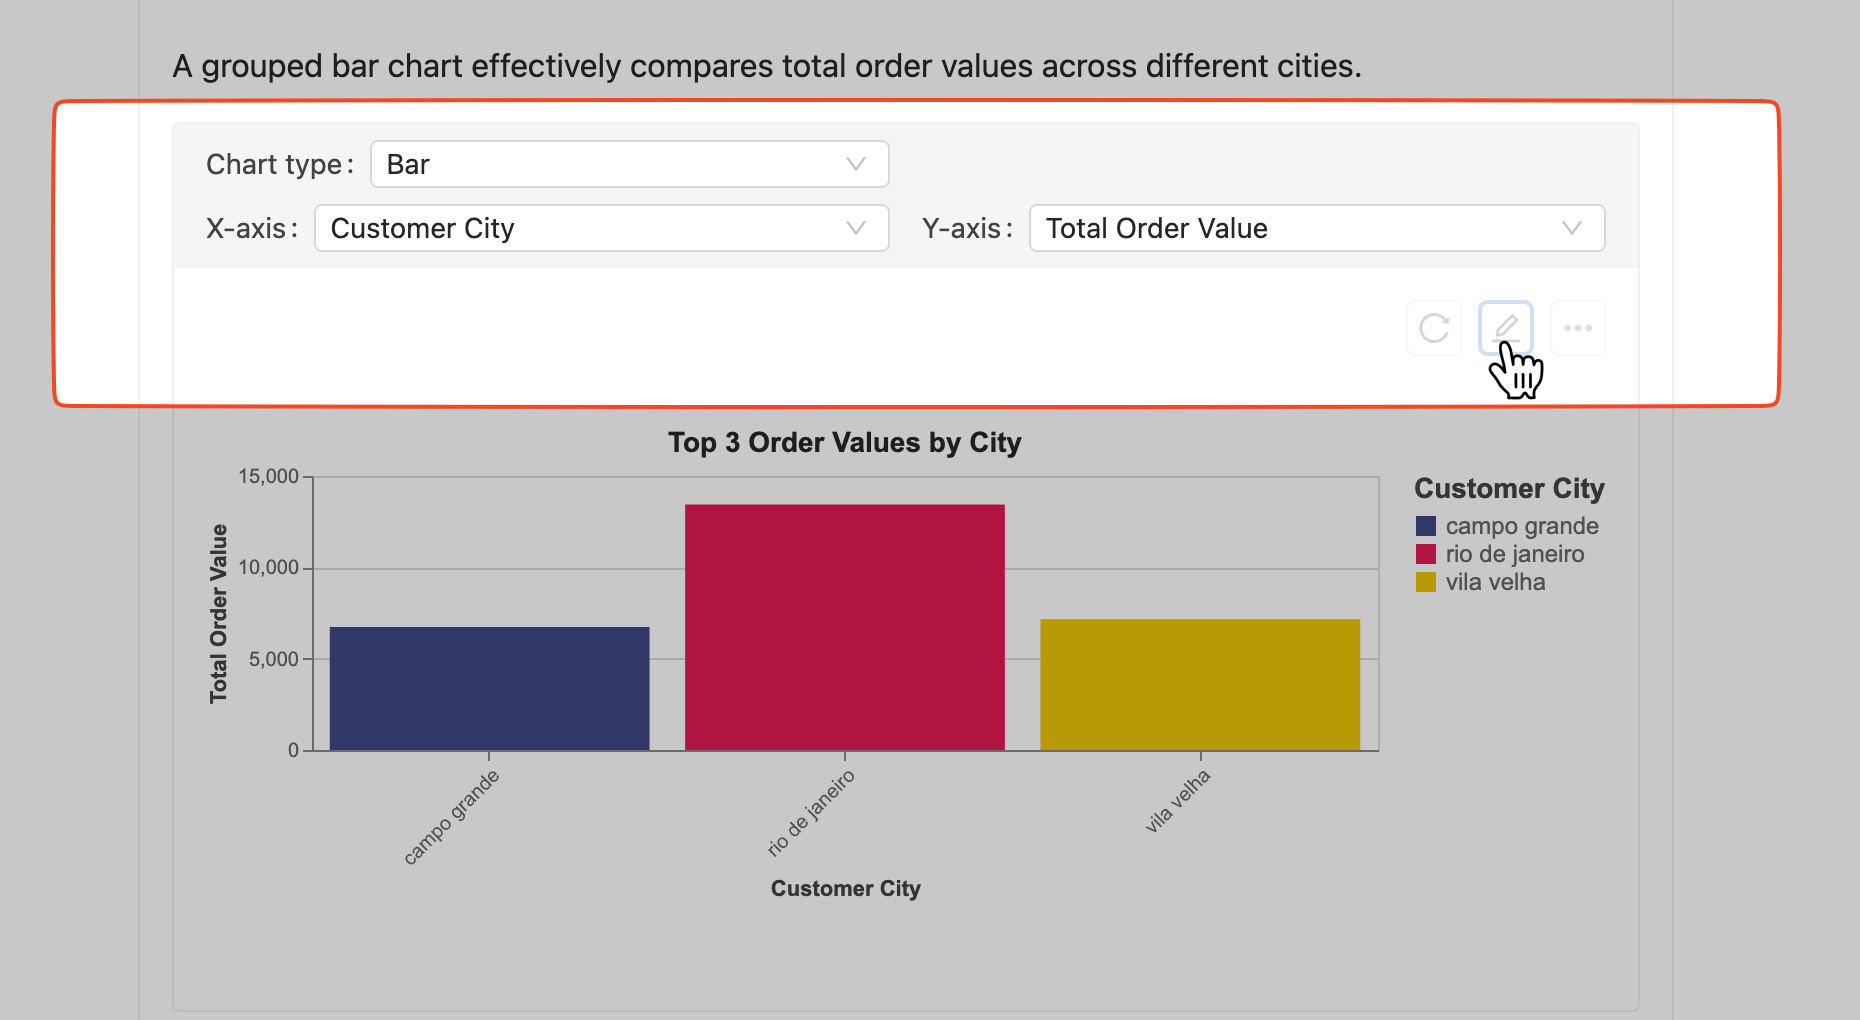
When adjusting your chart, you can modify the following fields to better suit your data visualization needs:
- Bar Chart: Adjust the
X-axis(categories) andY-axis(values) fields. - Group Bar Chart: Modify the
X-axis(main categories),Y-axis(values), andxoffset(sub-categories) fields. - Stacked Bar Chart: Change the
X-axis(categories),Y-axis(values), andColor(stack groups) fields. - Line Chart: Adjust the
X-axis(time series),Y-axis(values), andColor(line groups) fields. - Area Chart: Modify the
X-axis(time series) andY-axis(volume emphasis) fields. - Pie Chart: Change the
Theta(values) andColor(categories) fields.
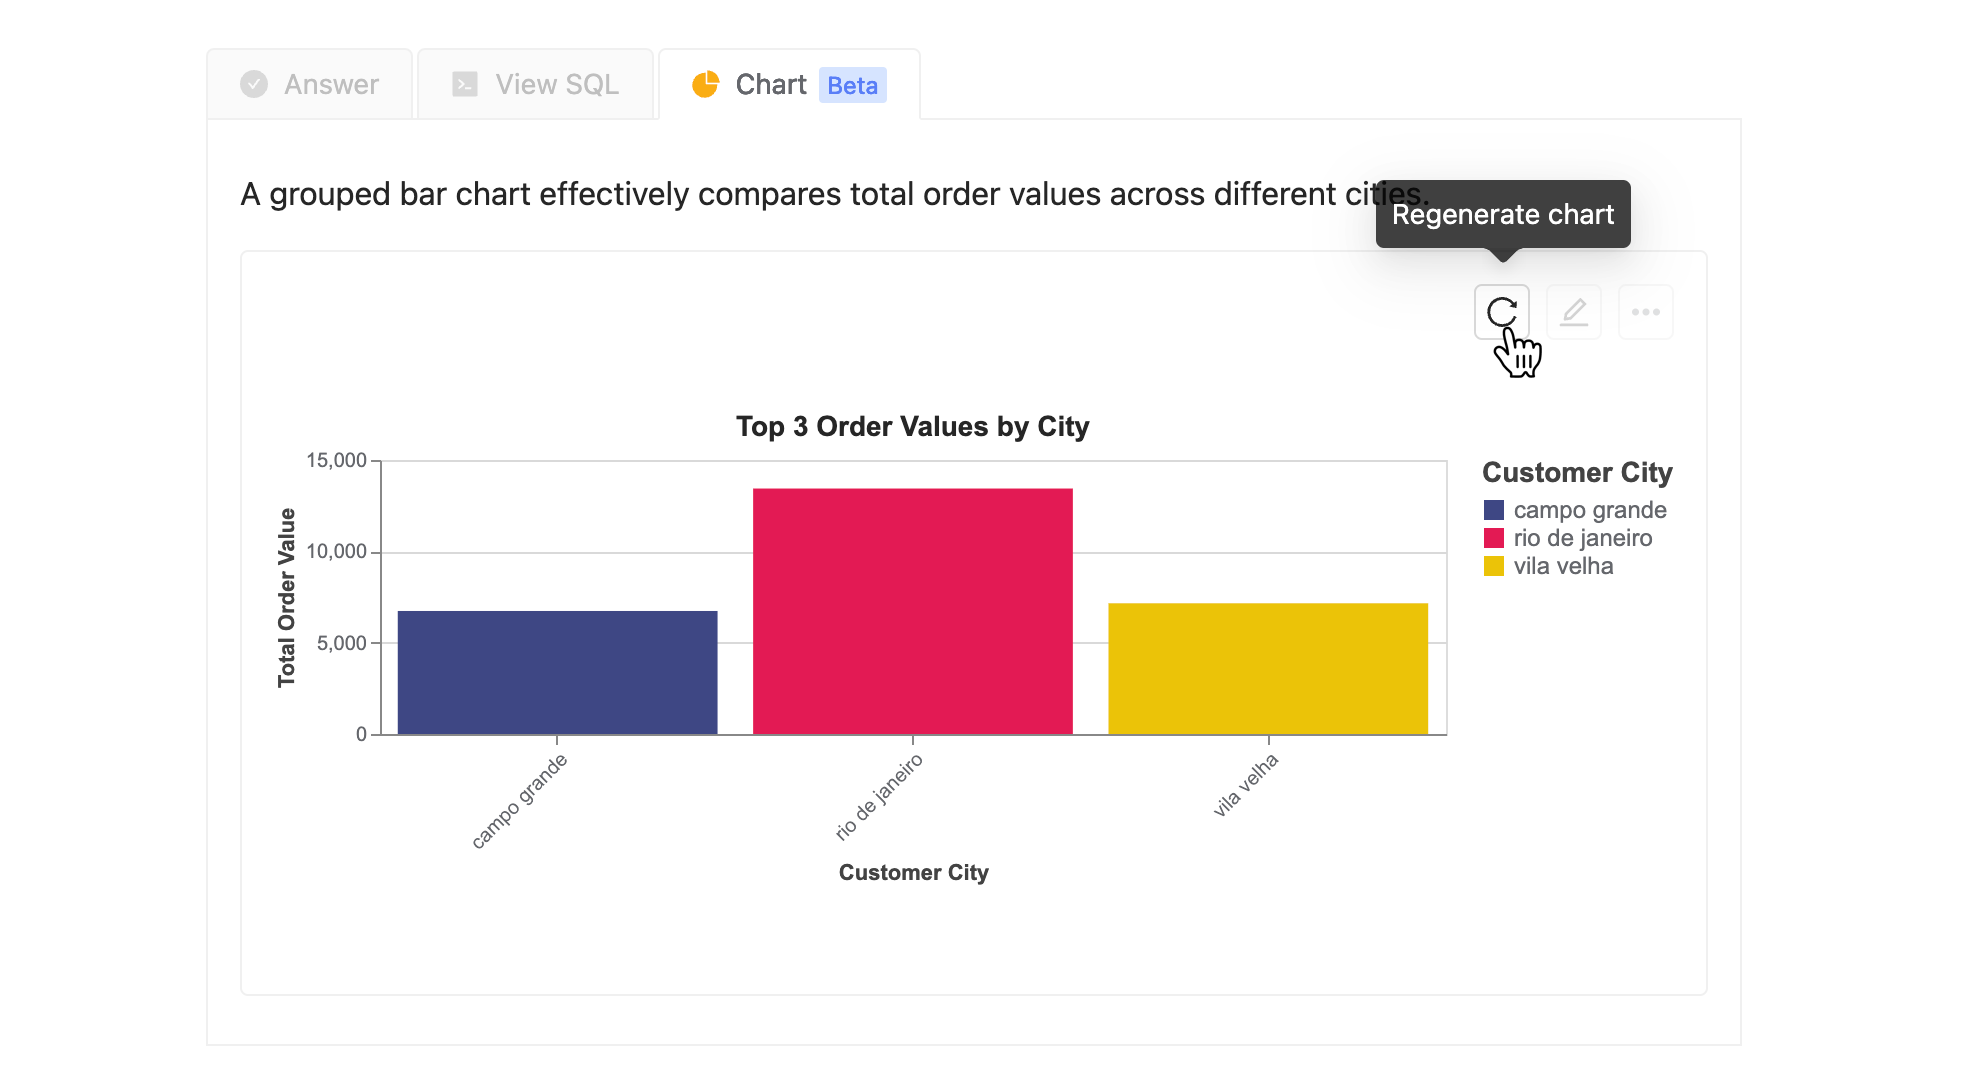
Regenerating the Chart
If you are not happy with the adjusted chart, you can click the "Regenerate" icon to use AI to generate a new chart.
Saving the Chart
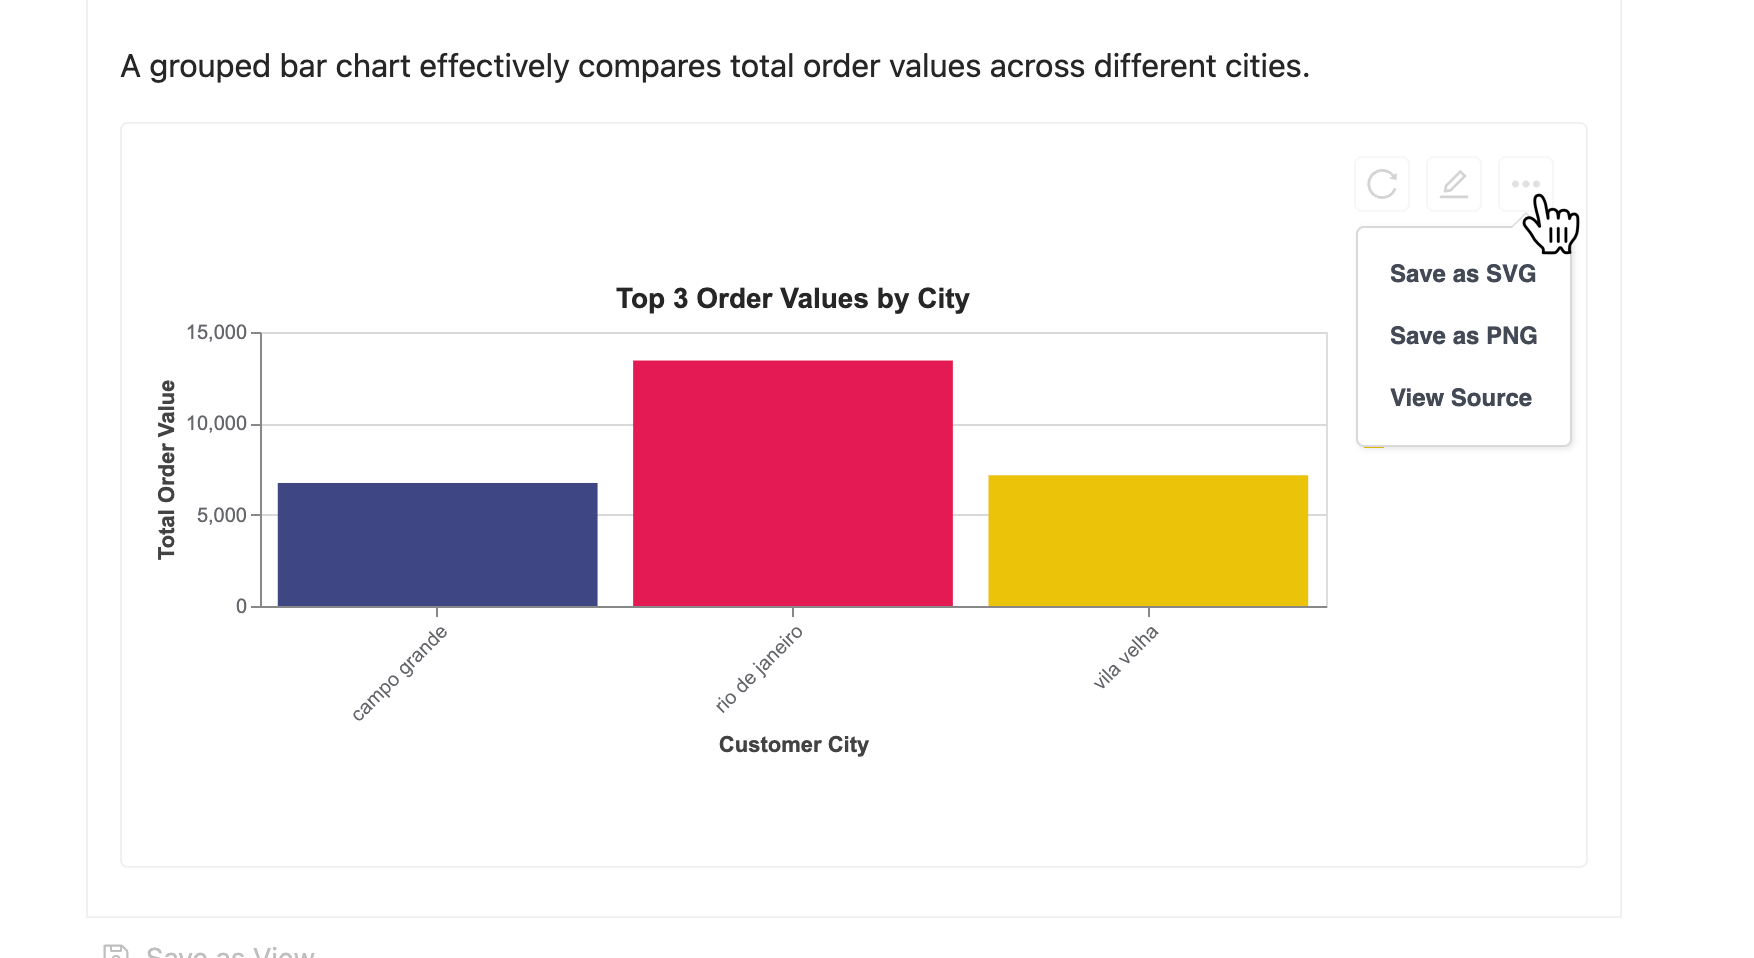
You can save the chart by clicking the "More" icon. We support downloading the chart in PNG and SVG formats.